The Caption Box element  displays a summary statistic value on the plot. The summary statistic corresponds to the variable that corresponds to the axis that you specify as the Response Axis in the Caption Box options.
Figure 2.39 Caption Box Options
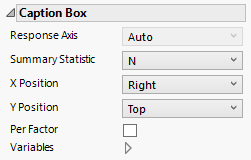
Specifies the summary statistic to be displayed for the variable defined by the Response Axis setting. The default Summary Statistic is the Mean. For details about how summary statistics are computed for categorical variables, see Summary Statistic for Categorical Variables.
Tip: If you have multiple graphs, you can color or size each graph by different variables. Drag a second variable to the Color or Size zone, and drop it in a corner. In the Variables option, select the specific color or size variable to apply to each graph.