The Reactor 20 Custom.jmp sample data table contains data from a 20-run design that was constructed using the Custom Design platform. The experiment investigates the effects of five factors on a yield response (Percent Reacted) for a chemical process.
|
1.
|
|
2.
|
In the Table panel, click the green triangle next to the DOE Dialog script.
|
|
3.
|
Open the Factors outline.
|
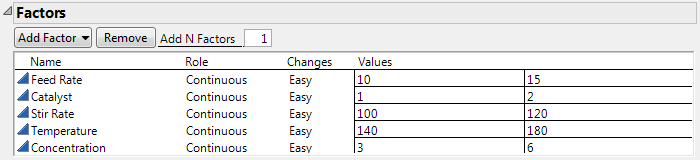
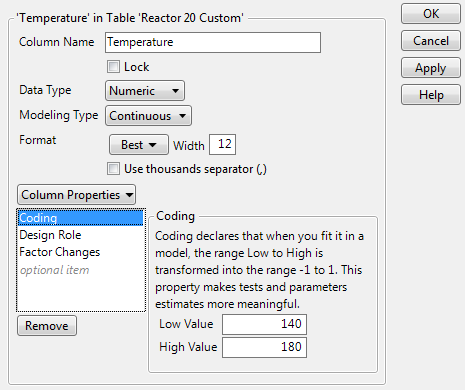
Notice that the settings for Temperature range from 140 to 180. When the design was generated, the Coding column property was assigned to Temperature. The Low Value is set to 140 and the High Value is set to 180.
|
5.
|
In the Reactor 20 Custom.jmp sample data table, click the asterisk next to Temperature in the columns panel and select Coding.
|
Figure A.14 Coding Panel for Temperature
|
6.
|
Click Cancel to close the Column Info window.
|
|
7.
|
In the Reactor 20 Custom.jmp sample data table, click the green triangle next to the Reduced Model script.
|
|
8.
|
Click Run.
|
Figure A.15 Effect Summary Report for Reduced Model
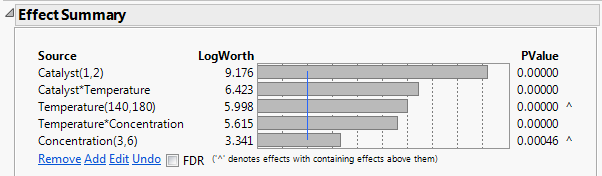
In the Source list, the High and Low values used in the Coding column property appear in parentheses to the right of the main effects, Catalyst, Temperature, and Concentration. The ranges imposed by the Coding property are not shown for the interaction effects.
Tip: Notice the “^” symbols to the right of the PValues for Temperature and Concentration. These symbols indicate that these main effects are components of interaction effects with smaller p-values. If an interaction effect is included in the model, then the principle of effect heredity requires that all component effects are also in the model. See Effect Heredity in Starting Out with DOE.
|
9.
|
Select Estimates > Show Prediction Expression from the red triangle next to Response Percent Reacted.
|
Figure A.16 Prediction Expression for Reduced Model
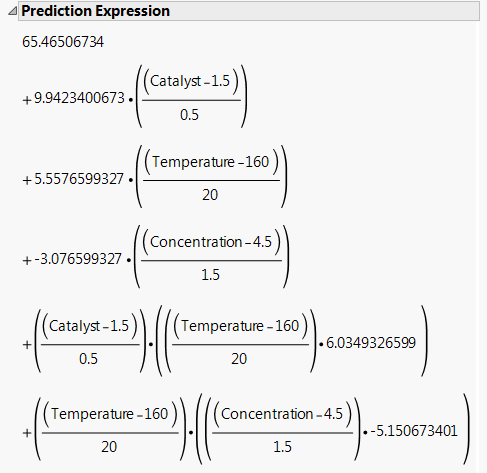
Each factor is transformed as specified by the Coding column property. For example, for Temperature, notice the following:
|
–
|
The Low Value in the Coding property was set to 140. The Temperature value of 140 is transformed to -1.
|
|
–
|
The High Value in the Coding property was set to 180. The Temperature value of 180 is transformed to +1.
|
|
–
|
The midpoint of the Low and High values is 160. The Temperature value of 160 is transformed to 0.
|
The transformed values help you compare the effects. The estimated coefficient for Catalyst is 9.942 and the estimated coefficient for Concentration is -3.077. It follows that the predicted effect of Catalyst on Percent Reacted is more than three times as large as the effect of Concentration on Percent Reacted. Also, the coefficients indicate that predicted Percent Reacted increases as Catalyst increases and decreases as Concentration increases.
|
•
|
When all factors are at their midpoints, their transformed values are 0. The predicted Percent Reacted is the intercept, which is 65.465.
|
|
•
|
When Catalyst and Concentration are at their midpoints, a 20 unit increase in Temperature increases the Percent Reacted by 5.558 units.
|
|
•
|
Suppose that Concentration is at its midpoint, so that its transformed value is 0:
|
|
–
|
When Catalyst is at its midpoint, a 20 unit increase in Temperature increases the Percent Reacted by 5.558 units.
|
|
–
|
When Catalyst is at its high setting, a 20 unit increase in Temperature increases the Percent Reacted by 5.558 + 6.035 = 11.593 units.
|
It follows that the coefficient of the interaction term, 6.035, is the increase in the slope of the model for predicted Percent Reacted for a 0.5 unit change in Catalyst.