JMP can compare two open data tables and report the differences between data, scripts, table variables, column names, column properties, and column attributes. Character values that do not match exactly appear in the report. For numeric data, you can select a relative (or fuzzy) comparison. The numeric values are considered equal if they are within the relative error rate that you specify. The smaller the relative error, the more precise the comparison.
|
2.
|
In one of the tables, select Tables > Compare Data Tables.
|
|
4.
|
(Optional) Select Fuzzy Compare and enter the relative error to see numeric differences within the specified rate.
|
|
6.
|
Click Compare.
|
The Tables Info report shows the data table names and locations along with the numbers of columns and rows in each table. In Figure 3.22, you see that Big Class1.jmp contains one more row than Big Class2.jmp.
Figure 3.22 Basic Information
|
•
|
The first entry in Figure 3.23 indicates that one row (N) has changed (or been replaced) in the first row of Big Class2.jmp. When you select the entry in the Difference Summary report on the left, the entry is highlighted in yellow, and the row flashes in the data table.
|
For a graphical view of the comparison, place your cursor over a colored cell in the Difference Plot. Figure 3.23 shows that the name KATIE in Big Class1.jmp was changed to KIM in Big Class2.jmp. The entire first row is highlighted in the Difference Plot, which tells you that all values in that row are different.
Figure 3.23 Modified Data
|
•
|
In Figure 3.24, the second entry indicates that two rows were deleted beginning at row four. The deleted rows are highlighted in Big Class1.jmp on the left. And the Difference Plot specifies the different values. The name in row four of Big Class1.jmp was JACLYN and TIM in Big Class2.jmp.
|
Figure 3.24 Deleted Rows
|
•
|
In Figure 3.25, the third entry tells you that one row was added before what was originally row eight. The name in row eight of Big Class1.jmp was ROBERT. PETER is the name in row six of Big Class2.jmp.
|
Figure 3.25 Identify New Rows
Click the Previous difference and Next difference buttons above the Difference Summary to navigate from row to row.
Tip: Save the Difference Summary report to a data table by selecting Save Difference Summary from the red triangle menu.
Select Compare Table Properties from the red triangle menu to see differences in table scripts and variables. For example, Figure 3.26 shows that the Distribution script in Big Class2.jmp refers to the height column rather than the weight column.
Figure 3.26 Modified Table Script
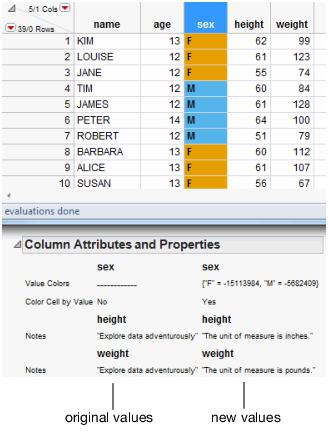
Select Compare Column Attributes and Properties from the red triangle menu to see differences in column notes, cell colors, and the like. For example, Figure 3.27 shows that column notes and value colors differ in Big Class2.jmp.
Figure 3.27 Modified Column Attributes and Properties