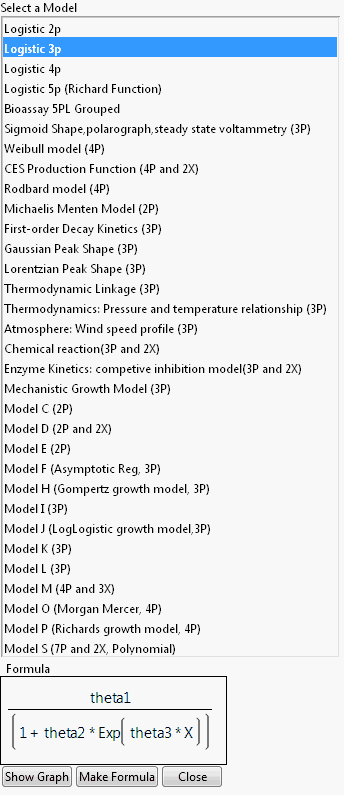
The Model Library can assist you in creating the formula column with parameters and initial values. Click the Model Library button on the Nonlinear launch window to open the library. Select a model in the list to see its formula in the Formula box (Figure 12.7).
Figure 12.7 Nonlinear Model Library Dialog
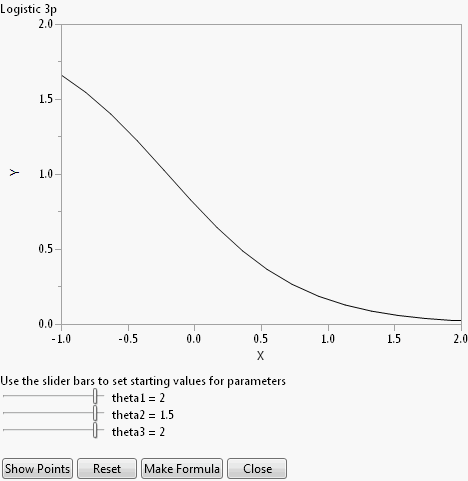
Click Show Graph to show a 2-D theoretical curve for one-parameter models and a 3-D surface plot for two-parameter models. No graph is available for models with more than two explanatory (X) variables. On the graph window, change the default initial values of parameters using the slider, or clicking and entering values in directly. See Figure 12.8.
Figure 12.8 Example Graph in Model Library
The Reset button sets the initial values of parameters back to their default values.
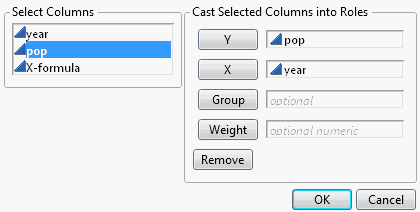
Click Show Points to overlay the actual data points to the plot. The dialog in Figure 12.9 opens, asking you to assign columns into X and Y roles, and an optional Group role. The Group role allows for fitting the model to every level of a categorical variable. If you specify a Group role here, also specify the Group column on the platform launch window.
Figure 12.9 Select Roles
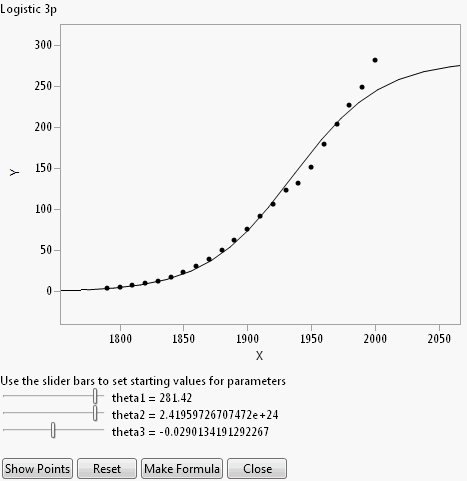
For most models, the starting values are constants. Showing points enables you to adjust the parameter values to see how well the model fits for different values of the parameters. For the US population example, the points are shown in Figure 12.10.
Figure 12.10 Show Points
Clicking Make Formula at this point (after using Show Points) creates a new data table column named after the model that you chose from the Model Library. This column has the formula as a function of the latest parameter starting values.
Note: If you click Make Formula before using the Show Graph or Show Points buttons, you are asked to provide the X and Y roles, and an optional Group role. See Figure 12.9. After that, you are brought back to the plot so that you have the opportunity to adjust the parameters starting values if desired. At that point click Make Formula again to create the new column.
Once the formula is created in the data table, continue the analysis by assigning the new column as the X, Predictor Formula in the Nonlinear launch dialog.
The Model Library is created by a built-in script named NonlinLib.jsl, located in the Resources/Builtins folder in the folder that contains JMP (Windows) or in the Application Package (Macintosh). You can customize the nonlinear library script by modifying this script.
To add a model, you must add three lines to the list named Listofmodellist#. These three lines are actually a list themselves, which consists of the following three parts.
Add the following lines to the NonlinLib.jsl script
{//Simple Exponential Growth
"Simple Exponential Growth",
Expr(Parameter({b1=2, k=0.5}, b1*exp(k * :X))),
lowx = -1; highx = 2; lowy = 0; highy = 2},
|
•
|
|
•
|
There is a comma as the last character in the example above. If this is the final entry in the Listofmodellist# list, the comma can be omitted.
|
To delete a model, delete the corresponding three-lined list from the Listofmodellist# list.


