project = New Project();
project << Run Script(
dt = Open( "$SAMPLE_DATA/Big Class.jmp" );
dt << Run Script( "Bivariate" );
dt << Run Script( "Distribution" );
);
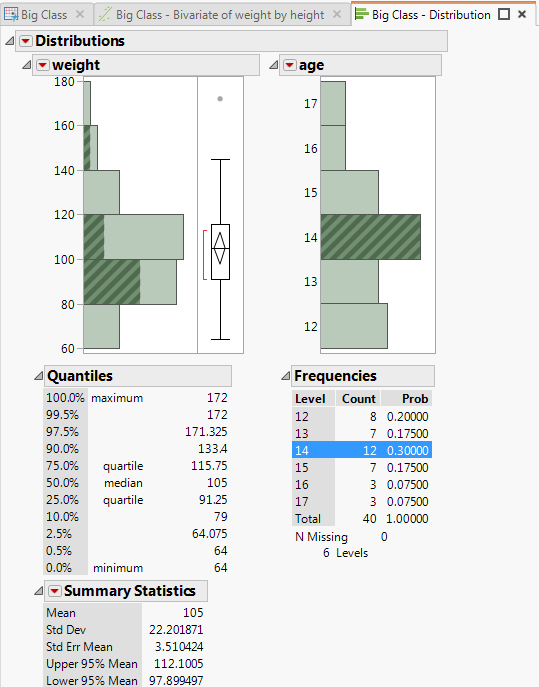
Figure 14.1 shows the project with selected bars, showing that the graph is still linked to the data table.
Figure 14.1 Example of a Simple Project
Note: The best way to learn how to script a project is to create it interactively, change the project file’s extension to .jsl, and open the file in JMP.