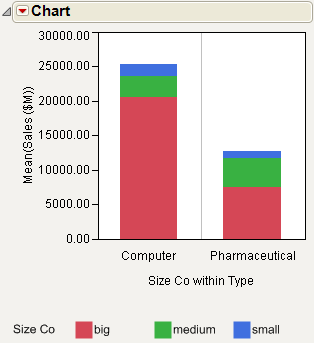
When you have two X levels and a single Y variable, stack the bars by selecting the Stack Bars command from the platform menu.
|
1.
|
|
2.
|
Select Graph > Legacy > Chart.
|
|
3.
|
|
4.
|
|
5.
|
|
6.
|
Select Mean from the menu of statistics.
|
|
7.
|
Click OK.
|
|
8.
|
Select Stack Bars from the red triangle menu for Chart.
|
Figure 13.15 Example of a Stacked Bar Chart
