Figure 7.2 Stage 1 Report for Main Effects
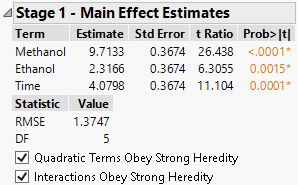
A two-degree-of-freedom error sum of squares is computed from the four runs corresponding to the two fake factors. Because the fake factors are, by construction, inactive, this estimate of error variance is unbiased. For each main effect, the main effects response YME is tested against this estimate. In this example, three factors, Methanol, Ethanol, and Time, have p-values smaller than the threshold value and are retained as active. For details about the threshold values, see Stage 1 Methodology.
The variability from the three inactive factors, Propanol, Butanol, and pH, is pooled with the fake factor sum of squares to produce the five-degree-of-freedom RMSE statistic shown in Figure 7.2.
Figure 7.3 Stage 2 Report for Even-Order Effects
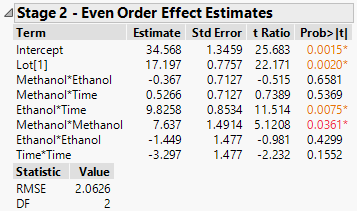
Because three main effects are identified as active in Stage 1, the guided subset selection procedure for active second-order effects can continue until all second-order effects are included. Because all six second-order effects are reported in Stage 2, it follows that the Stage 2 RMSE remained larger than the Stage 1 RMSE. See Stage 2 Methodology.
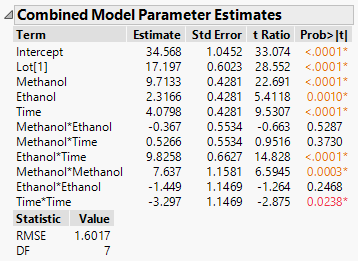
Figure 7.4 Combined Model Parameter Estimates Report