The following example uses the Big Class.jmp sample data table, which contains data on age, sex, height, and weight for 40 students. Examine the relationships between different variables.
|
1.
|
|
2.
|
Select Graph > Parallel Plot.
|
|
3.
|
|
4.
|
|
5.
|
|
6.
|
Select the Scale Uniformly check box.
|
|
7.
|
Click OK.
|
Figure 8.12 Height and Weight by Sex, Grouped by Age
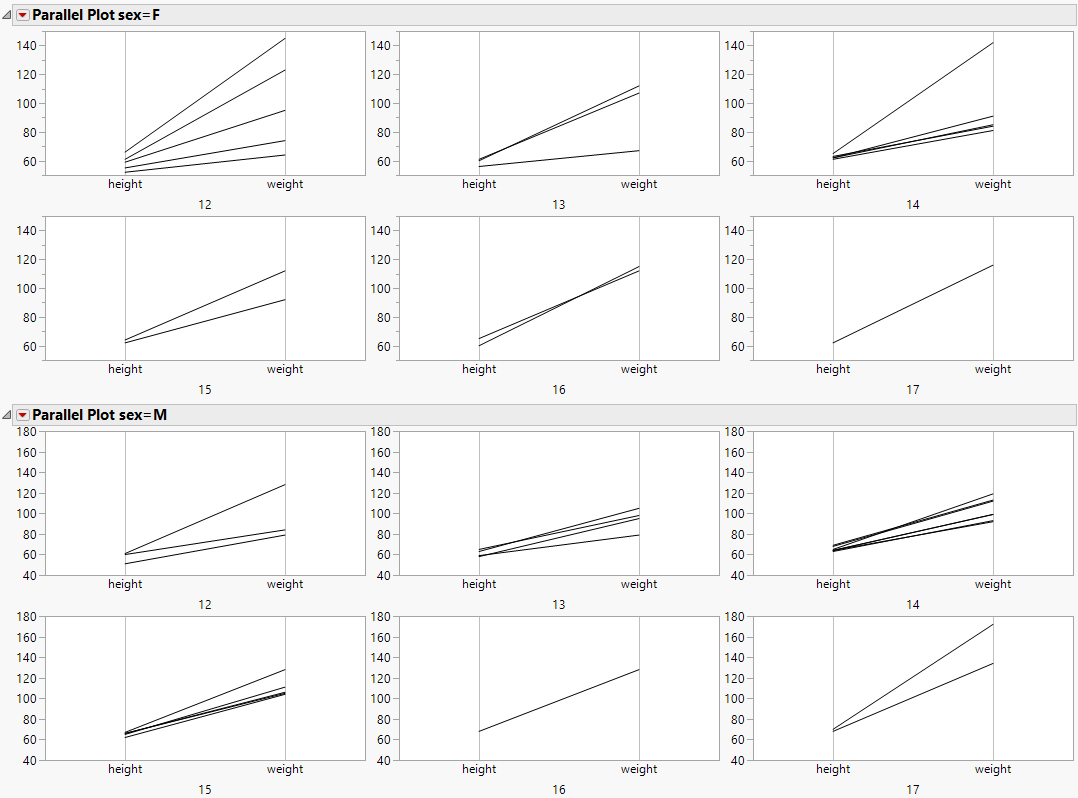
From Figure 8.12, you observe the following: