For example, using the Cities.jmp sample data table, specify a categorical Coloring variable as follows:
|
1.
|
|
2.
|
Select Graph > Legacy > Treemap.
|
|
3.
|
|
4.
|
|
5.
|
Click OK.
|
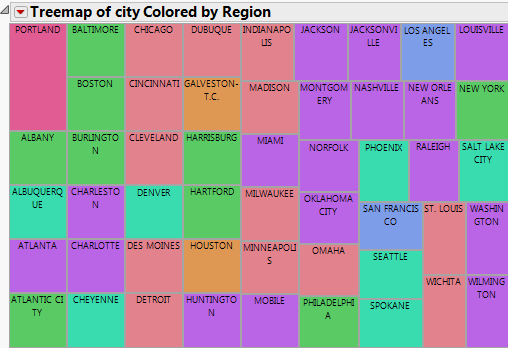
Figure 10.12 City Colored by Region
All of the cities belonging to the same region are colored the same color. The colors are chosen from JMP’s color theme. To change the default color theme, select Color Theme from the red triangle menu.
|
6.
|
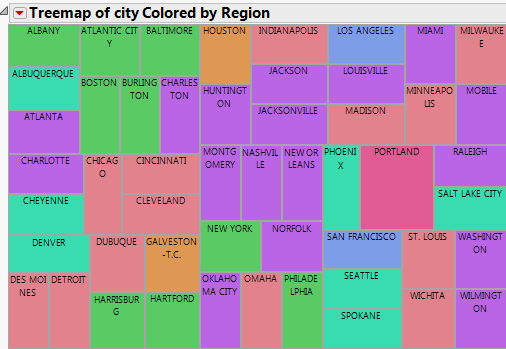
From the red triangle menu, select Layout > Squarify.
|
Figure 10.13 Squarify Treemap