This example uses the Dogs.jmp sample data table, which contains histamine level measurements for 16 dogs that were given two different drugs. The histamine levels were taken at zero, one, three, and five minutes. Examine the variation in the histamine levels for each drug.
|
1.
|
|
3.
|
Select Graph > Cell Plot.
|
|
4.
|
|
5.
|
Click OK.
|
Figure 9.2 Dogs.jmp cell plot
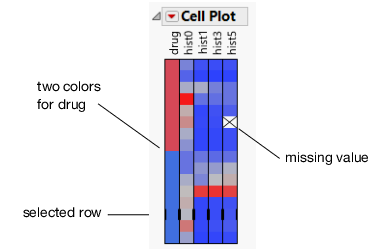
From Figure 9.2, notice the following: