This example uses the Pogo Jumps.jmp sample data table. The data, adapted from Aitchison (1986), show measurements for pogo jumps of seven finalists in the 1985 Hong Kong Pogo-Jump Championship. A single pogo jump is the total jump distance in three consecutive bounces, referred to as yat, yee, and sam.
|
1.
|
|
2.
|
|
3.
|
|
4.
|
Click OK.
|
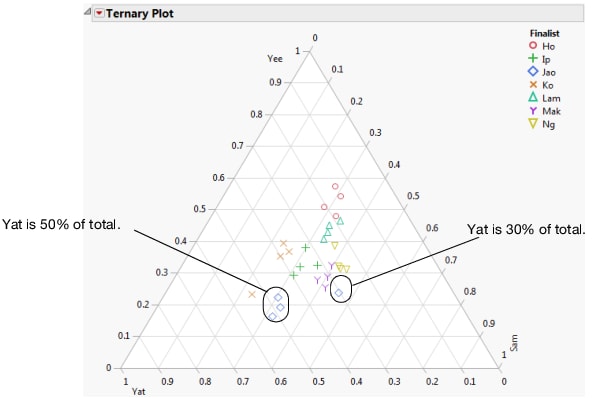
Figure 12.2 Example of a Ternary Plot

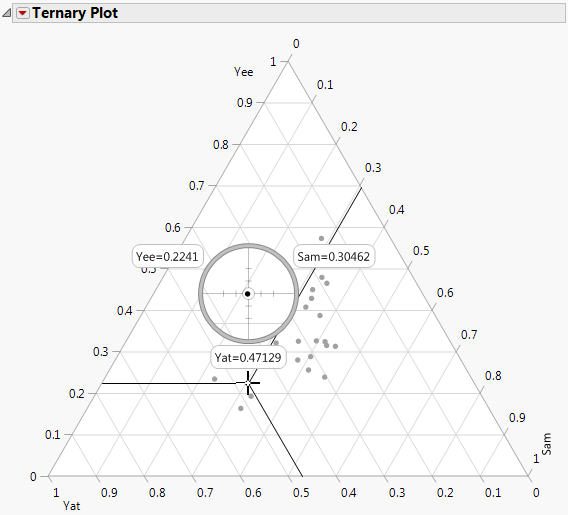
Figure 12.3 Using the Crosshairs Tool
|
1.
|
Right-click on the plot and select Row Legend.
|
|
2.
|
Select Finalist in the column list box.
|
Colors should be automatically set to JMP Default.
|
3.
|
|
4.
|
Click OK.
|
Figure 12.4 Pogo Data Colored by Finalist