This example shows how to use the Accelerated Life Test Design platform to augment an existing design. In this example, 150 capacitor units are tested across three temperatures (85o, 105o, and 125o Celsius) for 1500 hours. The results are recorded in the Capacitor ALT.jmp sample data table. The resulting model is used to predict the fraction of the population that is failing at 100,000 hours at a normal usage temperature of 25o Celsius.
|
1.
|
|
2.
|
Click the green triangle to run the Fit Life by X table script.
|
|
–
|
Click 105 above Temp and change it to 25.
|
|
–
|
Click 750.5 above Hours and change it to 100,000.
|
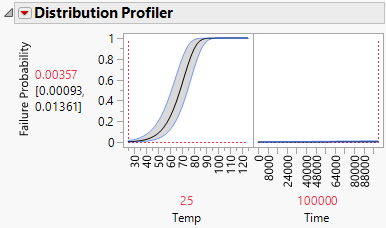
Figure 21.10 Distribution Profiler for Capacitor Model
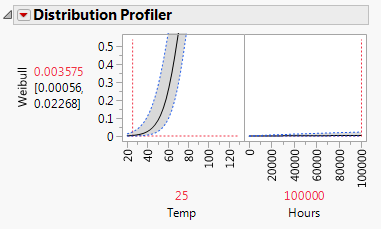
Based on your current study, the predicted fraction of the population that fails at 25o at 100,000 hours is 0.00358, with a 95% confidence interval of 0.00056 to 0.02268. You want to estimate the failure fraction more precisely. To decrease the width of the confidence interval, you can augment your study with additional tests.
|
1.
|
|
2.
|
|
3.
|
|
4.
|
Enter 5 for Number of Levels.
|
|
5.
|
|
6.
|
|
7.
|
Click Continue.
|
|
8.
|
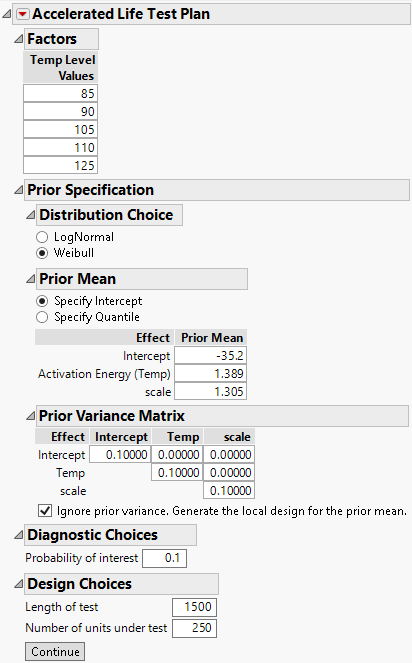
Enter 85, 90, 105, 110, and 125 for the Temp Level Values.
|
|
9.
|
|
10.
|
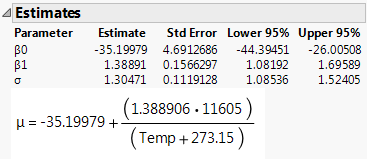
Under Prior Mean, select Specify Intercept.Enter the acceleration model parameter estimates from the Fit Life by X Estimates outline, found in the Weibull Results outline on the Statistics tab.
|
|
–
|
Enter -35.200 for Intercept.
|
|
–
|
Enter 1.389 for Activation Energy (Temp).
|
|
–
|
Enter 1.305 for scale.
|
For the Weibull distribution, JMP uses a parameterization that depends on a location parameter μ and scale parameter σ. In terms of the usual α and β parameterization, the scale parameter is σ = 1/β. See Weibull.
|
11.
|
Under Design Choices, enter 1500 for Length of test.
|
|
12.
|
Enter 250 for Number of units under test.
|
Figure 21.12 shows the completed Accelerated Life Test Plan outline.
Figure 21.12 Completed Design Details Window
|
13.
|
Click Continue.
|
|
14.
|
To account for the units at each setting of Temp from the previous experiment, enter the following under Candidate Runs.
|
|
15.
|
From the ALT Plan red triangle menu, select ALT Optimality Criterion > Make Failure Probability Optimal.
|
|
16.
|
Click Make Design.
|
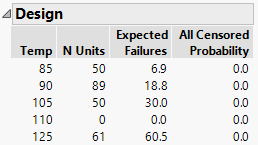
Figure 21.13 Optimal Design
|
•
|
50 units at 85oC. Since the previous experiment already tested 50 units at 85oC, no additional units are needed.
|
|
•
|
|
•
|
50 units at 105oC. Since the previous experiment test 50 units at 105oC, no additional units are needed.
|
|
•
|
0 units at 110oC. This level is not needed.
|
|
•
|
61 units at 125oC. Since the previous experiment test 50 units at 125oC, 11 additional units are needed.
|