|
1.
|
|
2.
|
|
3.
|
From any JMP window, select File > New > Dashboard.
|
|
4.
|
In Dashboard Builder, select the 2 x 1 Dashboard template.
|
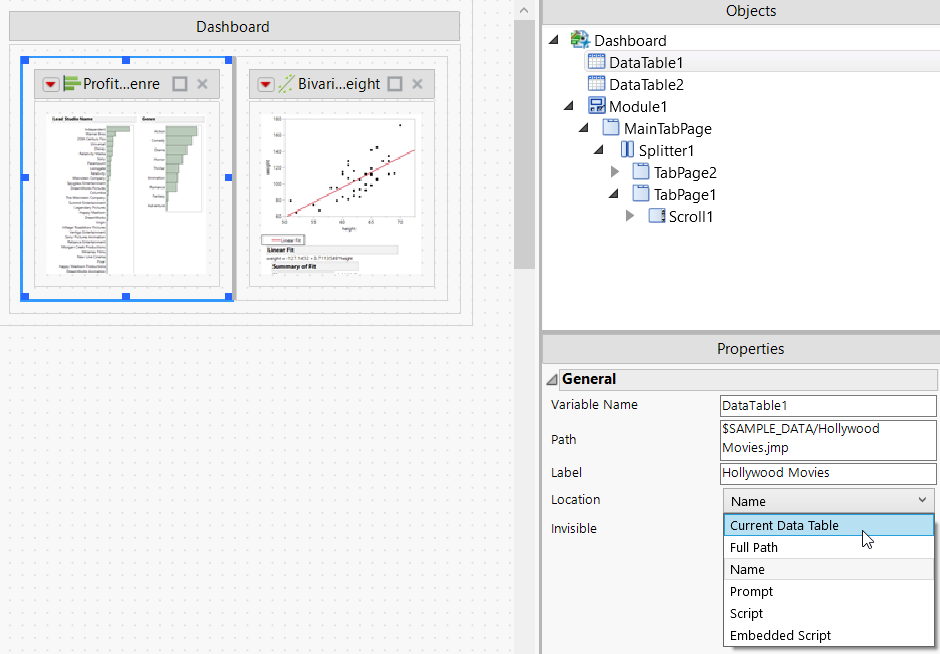
By default, this graph uses whatever data table is the current data table. In this example, Hollywood Movies.jmp stored in the Samples/Data folder is the current data table.
|
7.
|
Select Reference table by name to make sure the specified data table is always used to create the graph.
|
|
8.
|
Click OK.
|
In this example, Hollywood Movies.jmp in the Samples/Data folder will always be used as the current data table for the first graph, despite the current data table that is open.
|
1.
|
Select Show Properties from the Dashboard Builder red triangle menu.
|
Figure 10.17 The Objects and Properties Panes
|
2.
|
In the Objects pane, select DataTable1.
|