|
1.
|
|
2.
|
Run the Distribution table script to generate the report.
|
|
3.
|
|
6.
|
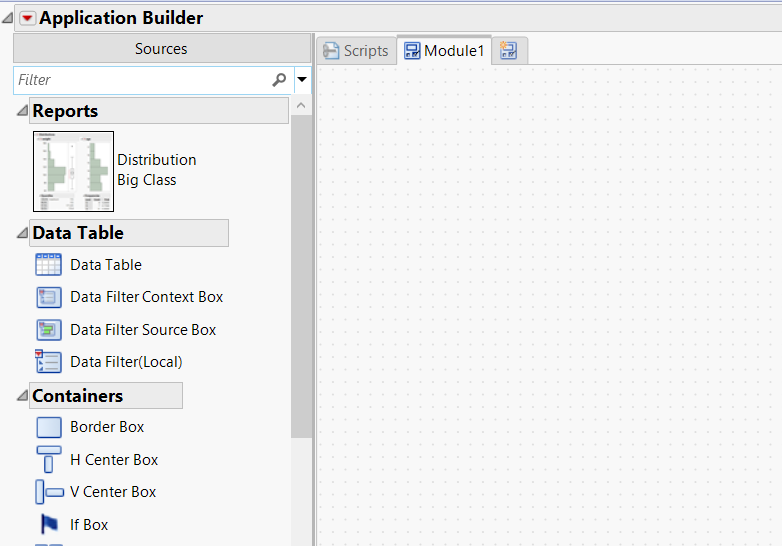
From the Application Builder red triangle menu, select Run Application.
|
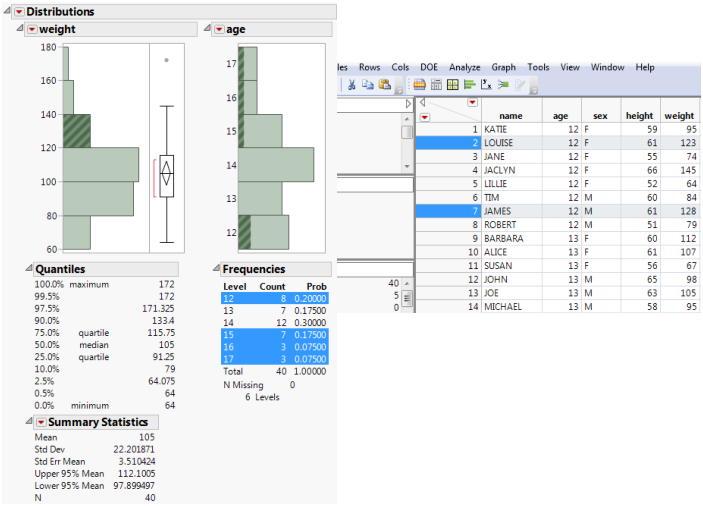
The Distribution report appears in a new window (Figure 15.3). Note that the histograms are interactive and still associated with the data table. When the data changes, you run the application again, and the Distribution report is updated.
Figure 15.3 Example of an Instant Application