A machine fills 8-ounce cans of two-cycle engine oil additive. The filling process is believed to be in statistical control. The process is set so that the average weight of a filled can (μ0) is 8.10 ounces. Previous analysis shows that the standard deviation of fill weights (σ0) is 0.05 ounces.
Subgroup samples of four cans are selected and weighed every hour for twelve hours. Each observation in the Oil1 Cusum.jmp data table contains one value of weight and its associated value of hour. The observations are sorted so that the values of hour are in increasing order. You want to be able to detect a 2σ shift in the process.
|
1.
|
|
2.
|
Select Analyze > Quality and Process > CUSUM Control Chart.
|
|
3.
|
|
4.
|
|
5.
|
Click OK.
|
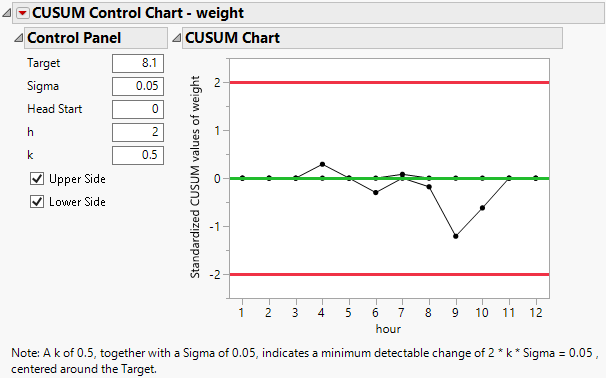
Figure 4.6 CUSUM Control Chart with Subgroups
Note: Montgomery (2013) states that “only if there is some significant economy of scale or some other valid reason for taking samples of size greater than one should subgroups of size greater than one be used with the CUSUM.” The use of rational subgroups in the tabular CUSUM chart does not always improve the performance of the chart.