In this example, you use the Cytometry.jmp sample data table to cluster observations using K Means Cluster. Cytometry is used to detect markers of the surface of cells and the readings from these markers help diagnose certain diseases. In this example, the observations are grouped based on readings of four markers in a cytometry analysis.
|
1.
|
|
2.
|
Select Analyze > Clustering > K Means Cluster.
|
|
3.
|
|
4.
|
Click OK.
|
|
5.
|
Enter 3 next to Number of Clusters.
|
|
6.
|
Enter 15 next to Range of Clusters (Optional).
|
|
7.
|
Click Go.
|
Figure 11.2 Cluster Comparison Report
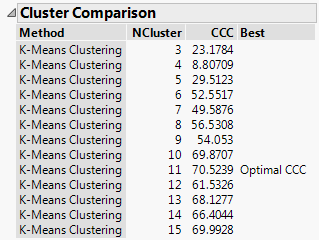
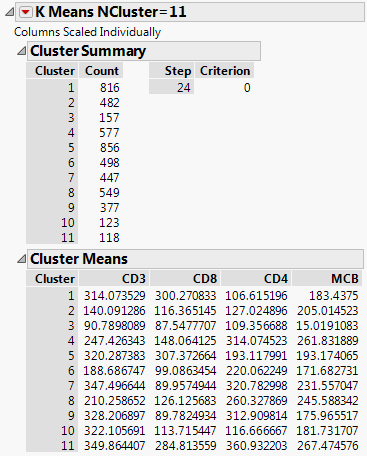
Figure 11.3 K Means NCluster=11 Report
|
9.
|
Click the K Means NCluster=11 red triangle and select Parallel Coord Plots.
|
Figure 11.4 Parallel Coordinate Plots for Cytometry Data
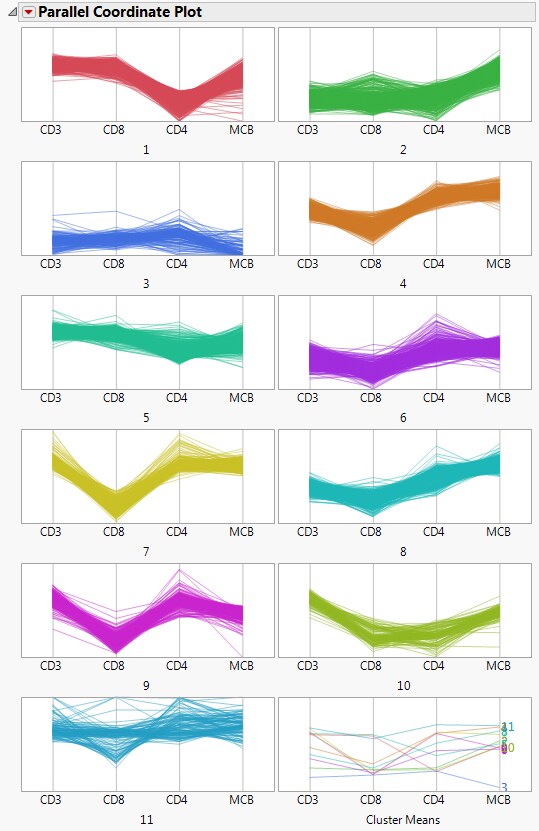
The Parallel Coordinate Plots display the structure of the observations in each cluster. Use these plots to see how the clusters differ. Clusters 4, 6, 7, 8, and 9 tend to have comparatively low CD8 values and high CD4 values. Cluster 1, on the other hand, has higher CD8 values and lower CD4 values.
Figure 11.5 Biplot for Cytometry Data
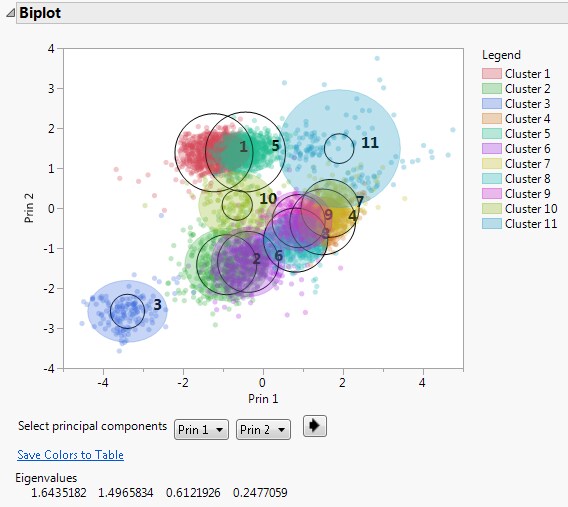
A legend that identifies the colors of the clusters is shown to the right of the plot. The clusters that appear to be most separated from the others based on their first two principal components are clusters 3, 10, and 11. This is supported by their parallel coordinate plots in Figure 11.4, which differ from the plots for the other clusters. Use the list below the plot to see the biplot for other combinations of principal components.