The Semiconductor Capability.jmp sample data table contains 128 columns of process measurements. Each column contains 1,455 measurements. You are interested in identifying unstable processes. Also, each column contains a Spec Limits column property. If a process is stable, it is appropriate to calculate its process capability. You proceed to assess both stability and capability for this data table.
|
1.
|
|
2.
|
Select Analyze > Screening > Process Screening.
|
|
3.
|
|
4.
|
Click OK.
|
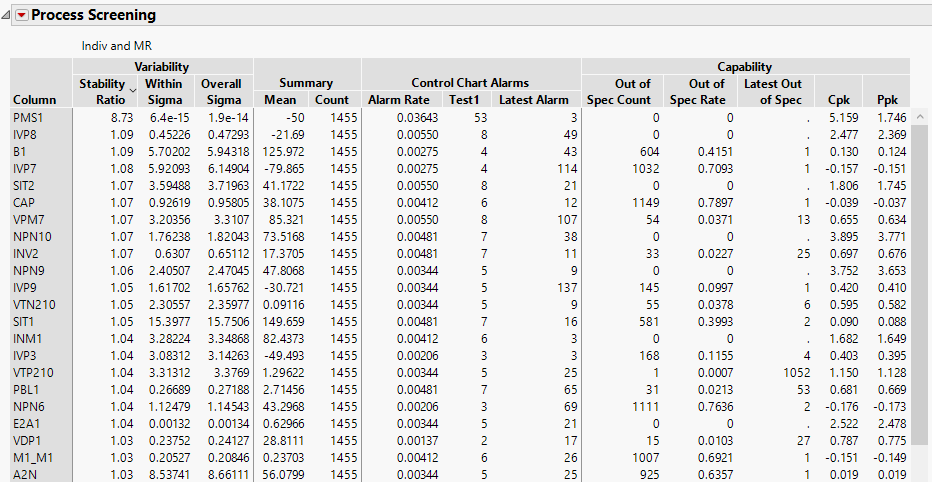
Figure 18.2 Partial View of Initial Report
|
5.
|
|
6.
|
Right-click the selected processes and select Quick Graph for Selected Items.
|
Figure 18.3 Quick Graphs for Highest Alarm Rate Processes

|
8.
|
Right-click the selected process and select Control Charts for Selected Items.
|
Figure 18.4 Control Chart Builder Report for IVP8
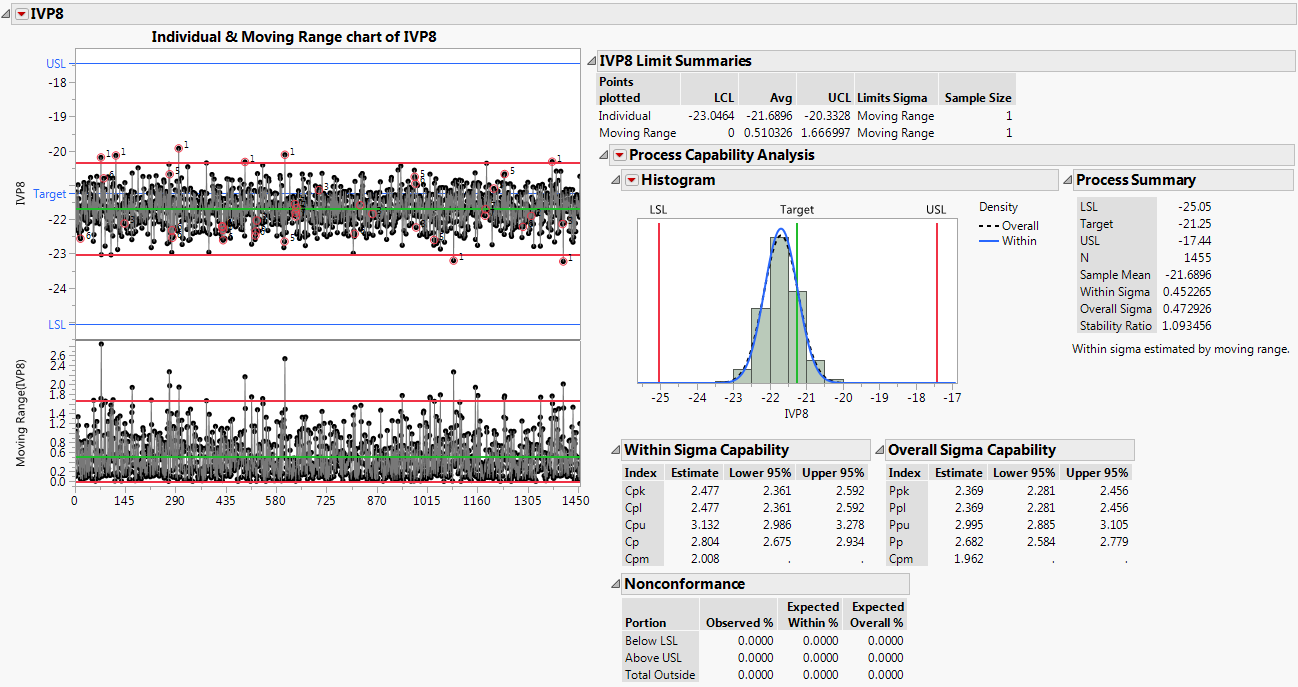
A Control Chart Builder report appears. Because IVP8 has a Spec Limits column property, the report also includes a capability analysis.