The Diabetes.jmp sample data table contains ten baseline variables used in modeling disease progression. In this example, you cluster the continuous baseline variables.
|
1.
|
|
2.
|
Select Analyze > Clustering > Cluster Variables.
|
|
3.
|
Select the columns Age through Glucose except for Gender (Age, BMI, BP, Total Cholesterol, LDL, HDL, TCH, LTG, and Glucose) and click Y, Columns.
|
The Gender column cannot be included because Cluster Variables requires numeric continuous variables.
|
4.
|
Click OK.
|
Figure 14.2 Cluster Variables Report for Diabetes Data
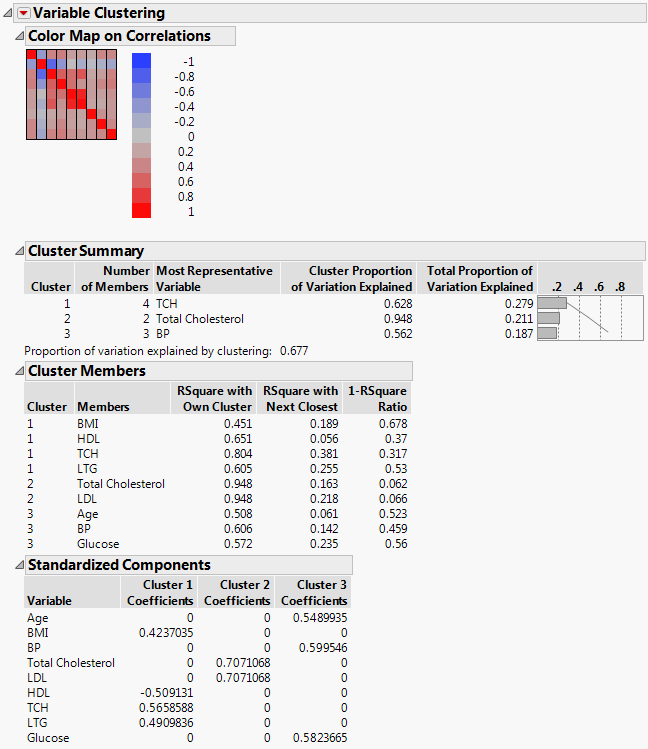
The Variable Clustering report is shown in Figure 14.2. The Cluster Summary report shows that the variables were grouped into three clusters:
|
•
|
Cluster 1 consists of BMI, HDL, TCH, and LTG, as shown in the Cluster Members report. The Cluster Summary report shows that TCH is the most representative variable for Cluster 1 and that it explains 62.8% of the Cluster 1 variation.
|
|
•
|
Cluster 2 consists of Total Cholesterol and LDL. The Cluster summary report shows that Total Cholesterol is the most representative variable for Cluster 2 and that it explains 94.8% of the Cluster 2 variation.
|
|
•
|
Cluster 3 consists of Age, BP, and Glucose. The Cluster Summary report shows that the most representative variable is BP and it explains 56.2% of the Cluster 3 variation.
|