The Arrhythmia.jmp sample data table contains information from 452 patient electrocardiograms (ECGs). The data was originally collected to classify different patterns of ECGs as cardiac arrhythmia. However, there are missing values in this data table. You are primarily interested in exploring these missing values and imputing them when necessary. Since you can only conduct missing value imputation for columns that have a continuous modeling type, you will conduct your analysis in two stages.
|
1.
|
|
2.
|
Select Analyze > Screening > Explore Missing Values.
|
|
3.
|
Select all columns (280 in all) and click Y, Columns.
|
|
4.
|
Figure 2.11 Missing Value Report
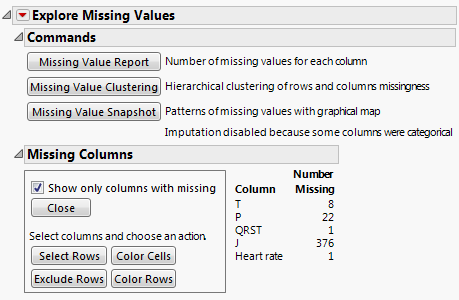
The Missing Columns report shown in Figure 2.11 indicates that only five columns have missing data. Out of a total of 452 rows, Column J has 376 missing values. Because it is largely missing, it is not useful for data analysis, even with imputed values. However, it might be useful to model Column J using the Informative Missing option in a platform that supports this option to see if values are perhaps not missing at random.
The five columns that have missing values are continuous. You proceed to impute values for the four columns other than Column J using multivariate imputation for the continuous columns in your data table. By doing so, you tacitly assume that the probabilities that values are missing depend only on the values of the continuous variables and not on the values of excluded nominal variables. To conduct this new analysis, you need to launch the Explore Missing Values utility again.
|
1.
|
Select Analyze > Screening > Explore Missing Values.
|
|
2.
|
In the launch window, click the red triangle next to 280 Columns.
|
|
3.
|
|
4.
|
|
5.
|
|
6.
|
Click OK.
|
|
7.
|
Click Multivariate Normal Imputation.
|
|
8.
|
Click Yes Shrinkage.
|
A JMP Alert appears, informing you that you should use the Save As command to preserve your original data.
|
9.
|
Click OK.
|
Figure 2.12 Imputation Report
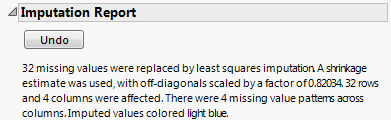
The Imputation Report in Figure 2.12 indicates how many missing values were imputed and the specific imputation details. No missing data remain in the four columns that had missing values.
Launch the Explore Missing Values modeling utility by selecting Analyze > Screening > Explore Missing Values. Enter the columns of interest into the Y, Columns list. You can also specify a By variable.