|
1.
|
|
2.
|
Select Analyze > Distribution.
|
|
3.
|
|
4.
|
Click OK.
|
|
5.
|
|
1.
|
|
2.
|
|
3.
|
|
4.
|
Click OK.
|
|
5.
|
From the red triangle menu, select Fit Line.
|
|
6.
|
From the red triangle menu, select Fit Orthogonal. Then select each of the following:
|
|
–
|
Specified Variance Ratio and type 0.2.
|
|
–
|
Specified Variance Ratio and type 5.
|
Figure 4.44 Example of Orthogonal Fitting Options
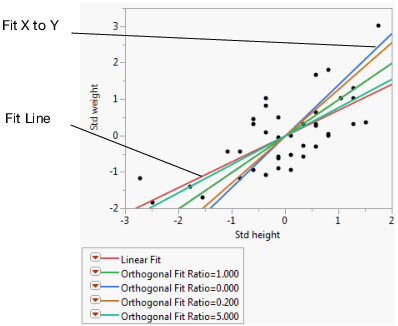
The scatterplot in Figure 4.44 shows the standardized height and weight values with various line fits that illustrate the behavior of the orthogonal variance ratio selections. The standard linear regression (Fit Line) occurs when the variance of the X variable is considered to be very small. Fit X to Y is the opposite extreme, when the variation of the Y variable is ignored. All other lines fall between these two extremes and shift as the variance ratio changes. As the variance ratio increases, the variation in the Y response dominates and the slope of the fitted line shifts closer to the Y by X fit. Likewise, when you decrease the ratio, the slope of the line shifts closer to the X by Y fit.