|
1.
|
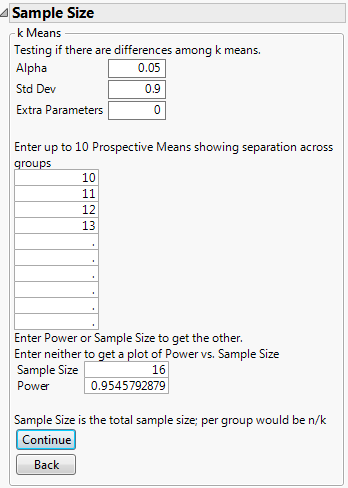
Select DOE > Design Diagnostics > Sample Size and Power.
|
|
2.
|
Click k Sample Means.
|
|
3.
|
Leave Alpha as 0.05.
|
|
4.
|
Enter 0.9 for Std Dev.
|
|
5.
|
Leave Extra Parameters as 0.
|
|
7.
|
Enter 16 for Sample Size.
|
|
8.
|
Leave Power blank.
|
|
9.
|
Click Continue.
|
Figure 16.9 Prospective Power for 4 Means
|
12.
|
Click Continue to launch a plot of power versus sample size.
|
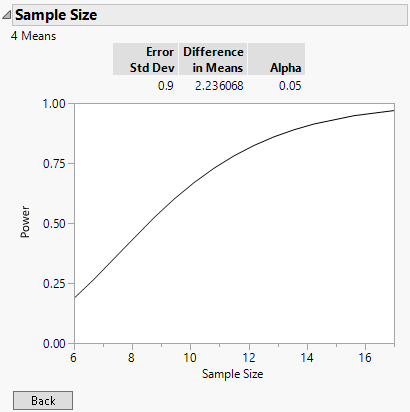
The plot also reports the difference in means, which is calculated as the square root of the sum of squared deviations from the grand mean. In this case, it is the square root of (–1.5)2 + (–0.5)2 + (0.5)2 + (1.5)2, which is the square root of 5. Therefore, the difference in means in this example is approximately 2.236.