This example uses the Plasticizer.jmp sample data table There are three mixture components (p1, p2, and p3) and one response (Y). There are constraints on the component levels. This data table already contains a saved prediction formula column for the response.
|
1.
|
|
2.
|
Select Graph > Mixture Profiler.
|
|
3.
|
|
4.
|
Note: The Y column role is set to Y in the Columns list. The role automatically assigns columns in launch windows. In this case, the Y column was assigned to the Y role when the mixture profiler was launched. However, the Y column does not contain a formula, and the Mixture Profiler Y column requires a formula column.
|
5.
|
Click OK.
|
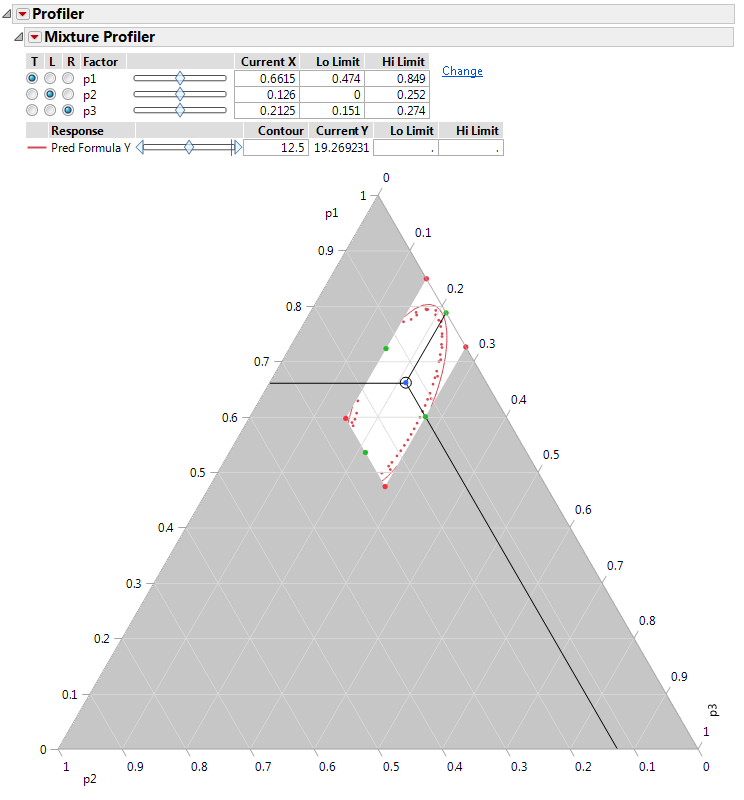
Figure 5.4 Example of Mixture Profiler