This example uses the Consumer Preferences.jmp sample data table, which contains survey data on people’s attitudes and opinions, as well as questions concerning oral hygiene. You can use the Test Multiple Response option to test if the response rates for each brushing time (Brush Delimited) is the same across groups (Brush). The groups are defined by the frequency that responders brush their teeth.
|
1.
|
|
2.
|
|
3.
|
|
4.
|
|
5.
|
Click OK.
|
|
6.
|
Figure 4.8 Test Multiple Response, Poisson
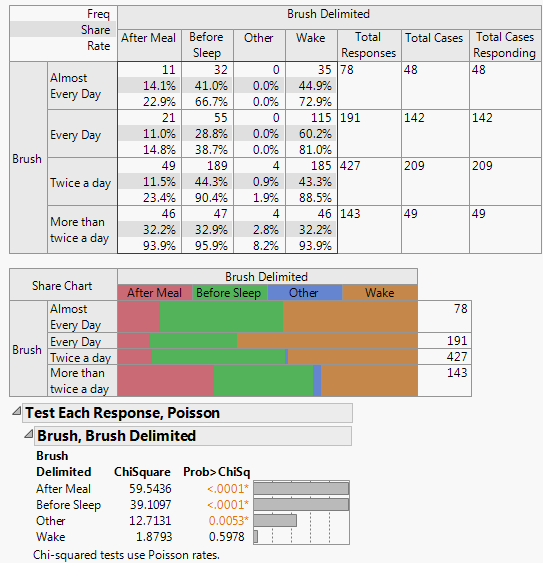
The p-values show that the response rates for After Meal, Before Sleep, and Other are significantly different across brushing groups. Wake is not significantly different across brushing groups. From the Crosstab table, you can see that most people brush their teeth when they wake up regardless of how frequently they brush their teeth.
|
7.
|
Click the Categorical red triangle menu and select Test Multiple Response > Homogeneity Test, Binomial.
|
Figure 4.9 Test Multiple Response, Binomial

The Homogeneity Test, Binomial option always produces a larger test statistic (and therefore a smaller p-value) than the Count Test, Poisson option. The binomial distribution compares not only the rate at which the response occurred (the number of people who reported that they brush upon waking) but also the rate at which the response did not occur (the number of people who did not report that they brush upon waking).
In this example, the proportion of responders for each response (After Meal, Before Sleep, Wake, and Other) differ across the age groups. The p-value for each response is less than 0.05.