This example uses the Car Poll.jmp sample data table. Examine the relative probabilities of being married and single for the participants in the poll.
|
1.
|
|
2.
|
Select Analyze > Fit Y by X.
|
|
3.
|
|
4.
|
|
5.
|
Click OK.
|
|
6.
|
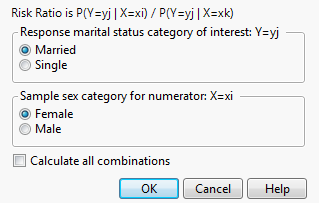
Figure 6.109 The Choose Relative Risk Categories Window
|
•
|
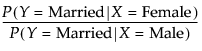
If you are interested in only a single response and factor combination, you can select that here. For example, if you clicked OK in the window in Figure 6.109, the calculation would be as follows:
|
|
•
|
If you would like to calculate the risk ratios for all (
 =4) combinations of response and factor levels, select the Calculate All Combinations check box. See Figure 6.110. =4) combinations of response and factor levels, select the Calculate All Combinations check box. See Figure 6.110. |
|
7.
|
Ask for all combinations by selecting the Calculate All Combinations check box. Leave all other default selections as is.
|
Figure 6.110 Example of the Risk Ratio Report
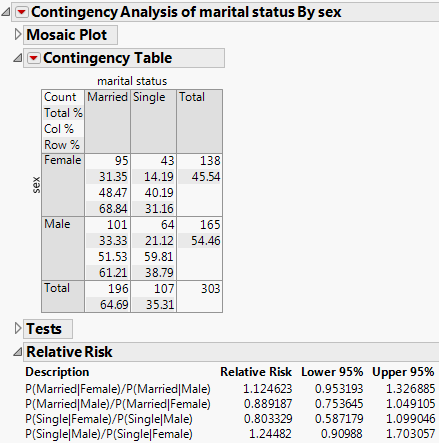
 = 1.1247