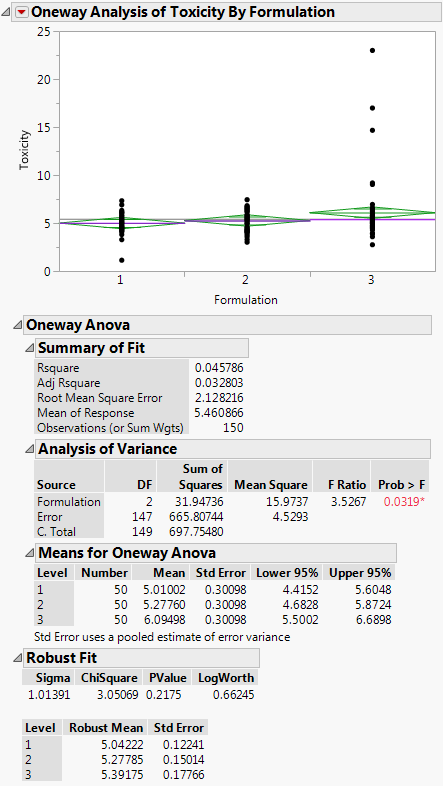
The data in the Drug Toxicity.jmp sample data table shows the toxicity levels for three different formulations of a drug.
|
1.
|
|
2.
|
Select Analyze > Fit Y by X.
|
|
3.
|
|
4.
|
|
5.
|
Click OK.
|
|
6.
|
From the red triangle menu, select Means/Anova.
|
|
7.
|
From the red triangle menu, select Robust > Robust Fit.
|
Figure 5.80 Example of Robust Fit