|
1.
|
|
2.
|
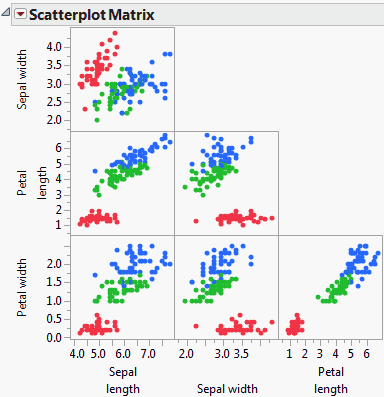
Select Graph > Scatterplot Matrix.
|
|
3.
|
|
4.
|
|
5.
|
Click OK.
|
Figure 11.7 Initial Example Using a Grouping Variable
|
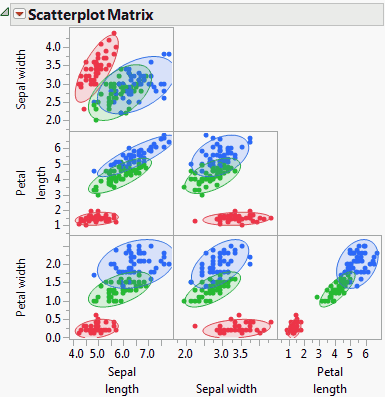
6.
|
From the red triangle menu, select Density Ellipses > Density Ellipses.
|
|
7.
|
From the red triangle menu, select Density Ellipses > Shaded Ellipses.
|
Figure 11.8 Example of a Scatterplot Matrix with Ellipses