|
1.
|
|
2.
|
Select Graph > Graph Builder.
|
|
3.
|
|
4.
|
|
6.
|
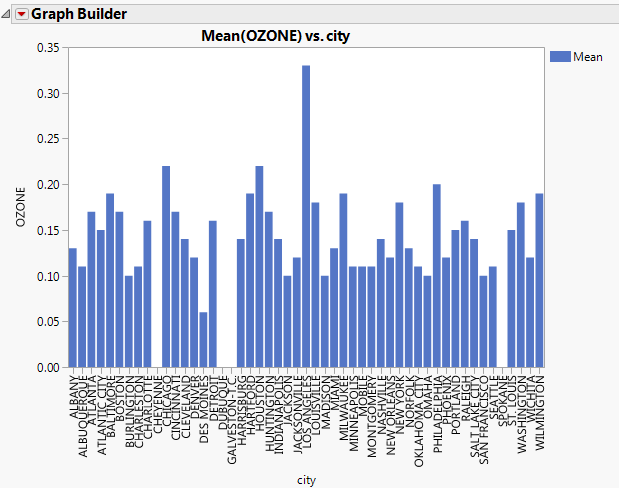
Click Done.
|
Figure 10.4 Bar Chart in Graph Builder
|
7.
|
Return to the Cities.jmp sample data table.
|
|
8.
|
Select Graph > Graph Builder.
|
|
9.
|
|
10.
|
|
11.
|
|
12.
|
|
14.
|
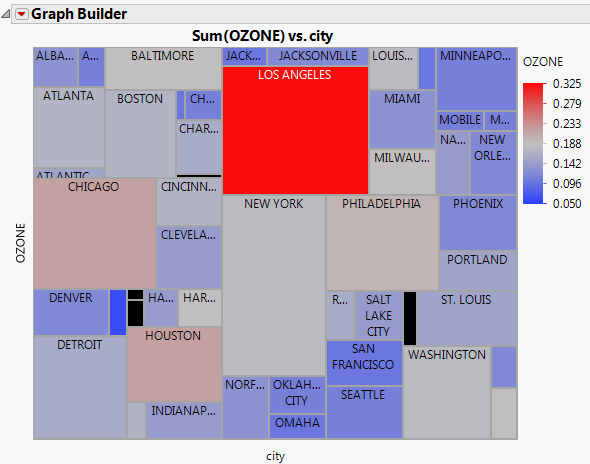
Click Done.
|
Figure 10.5 Treemap in Graph Builder