1.
Select Help > Sample Data Library and open Plasticizer.jmp.
The p1, p2, and p3 columns all have Mixture Column Properties defined.
2.
From the Graph menu, select Ternary Plot.
3.
Select p1, p2, and p3 and click X, Plotting.
4.
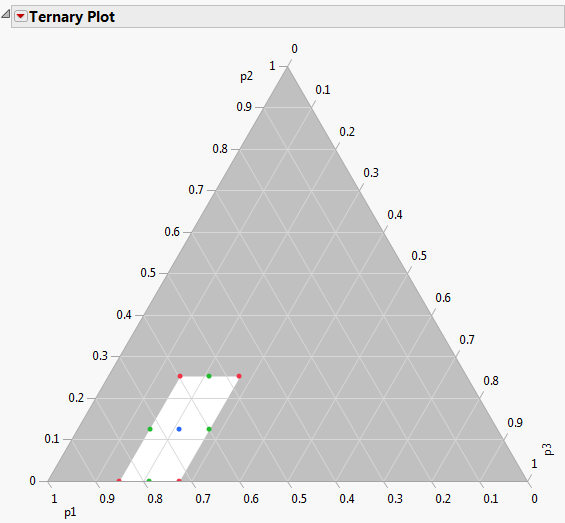
Figure 12.7 Mixture Constraints in a Ternary Plot

Help created on 7/12/2018