Example scripts are located in the Samples/Scripts folder.
|
1.
|
stringFunction(i);
Figure 3.11 Set the Breakpoint
|
3.
|
Click Run.
|
|
–
|
stringFunction is defined as a function.
|
|
–
|
str is defined as an empty string.
|
Both variables and their types and values have been added to the Globals list. In addition, the For() loop has been evaluated up to the line with the breakpoint, shown in Figure 3.11.
|
–
|
i has been assigned to 0.
|
|
–
|
i and its value and type have been added to the Globals list.
|
|
–
|
i has been determined to be less than or equal to 9.
|
|
–
|
stringFunction() has not yet been called.
|
Figure 3.12 View the Initial Global Variables
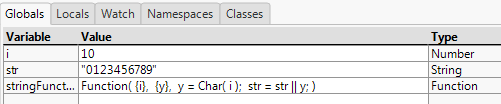
Tip: The initial value of i is 10 because the script was run before entering the Debugger; it’s showing the value of i after running the script (10). Start a new instance of JMP, open the script without running it, and enter the Debugger immediately.
|
4.
|
Click Run again.
|
|
–
|
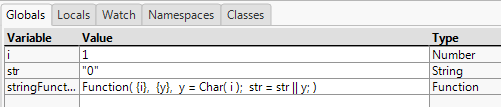
stringFunction() is called, evaluated, and returns to the loop.
|
|
–
|
i is incremented and determined to be less than or equal to 9.
|
|
–
|
Figure 3.13 Global Variables at First Breakpoint
|
5.
|
Click Run again.
|
|
–
|
stringFunction() is called, evaluated, and returns to the loop.
|
|
–
|
i is incremented and determined to be less than or equal to 9.
|
Figure 3.14 Global Variables at Second Breakpoint
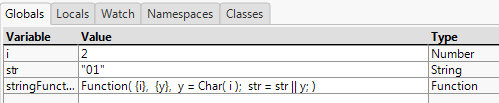
You can continue to click Run and watch i and str change with each iteration of the loop. Or, click Run without breakpoints to complete running the script and exit the Debugger.
Step Into, Step Over, and Step Out offer flexibility when your script contains expressions, functions, or includes other JSL files.
|
1.
|
|
3.
|
Click Step Over.
|
|
4.
|
Click Step Over again.
|
|
5.
|
Click Step Over again.
|
|
6.
|
Click Step Over.
|
|
7.
|
Continue clicking Step Over until the expression ends.
|
|
8.
|
Click Step Over to run the function without stepping into it. The Debugger runs the entire function, and returns to the line following the function call.
|
|
9.
|
Click Step Into.
|
|
10.
|
Click Step Over.
|
|
11.
|
Click Step Out.
|
The Debugger runs the rest of the included script and returns to the line following the Include() function.
|
1.
|
|
2.
|
Click Step Over.
|
The fourth line turns off Names Default To Here. If you run this script again in the same JMP session, this line resets the scoping so that the first variable that is created is in the global scope.
|
3.
|
Click Step Over.
|
A global variable named x is created. On the Globals tab, x has been added to the list, showing its value as 5 and its type as number.
|
4.
|
The global variable x is also shown here.
|
5.
|
Click Step Over twice.
|
Names Default To Here is turned on, which places the rest of the script into a Here scope. Then a new variable x is created in that scope.
Notice that the value of the global variable x has not changed.
|
6.
|
Select Here from the list on the Locals tab.
|
|
7.
|
Click Step Over.
|
A Local Here scope is created. A second Here scope is shown in the Locals list.
|
8.
|
Click Step Over.
|
A new x variable is created in this Here scope. On the Locals tab, select each of the three scopes from the list (Here, Here, and Global) to see three different x variables.
|
9.
|
Click Step Over.
|
Look in the Debugger’s log to see the output. Notice that here:x scopes to the local here, not the script window’s here.
|
10.
|
Click Step Over.
|
After writing an empty line to the log, the script exits the Local Here scope. The second Here, along with its’ x variable, has disappeared from the Locals list.
|
11.
|
Click Step Over.
|
A namespace called “test” is created, with another variable named x. Select the Namespaces tab to see it.
|
12.
|
Click Step Over and look at the log.
|
|
13.
|
Click Step Over to exit the Debugger.
|
|
1.
|
|
2.
|
Click Step Over twice.
|
The New Window expression is evaluated, and a modal window waiting for input is created. You might need to move the Debugger window to see the new modal window.
|
4.
|
Click Step Over three times and look at the log in the Debugger.
|
|
5.
|
Click Step Into to exit the Debugger.
|
|
1.
|
Open the string.jsl sample script.
|
|
2.
|
 .
.|
3.
|
 .
.
Figure 3.15 Initial JSL Profiler Window
|
4.
|
 to start profiling.
Figure 3.16 Profiled Script Window
In the left margin, the selected statistics are displayed. Percent of time is displayed by default. Click the Show Profile by Count button  to switch to percent of statement counts instead. The left margin is color-coded to allow for quick identification of problematic performance areas.
to switch to percent of statement counts instead. The left margin is color-coded to allow for quick identification of problematic performance areas.