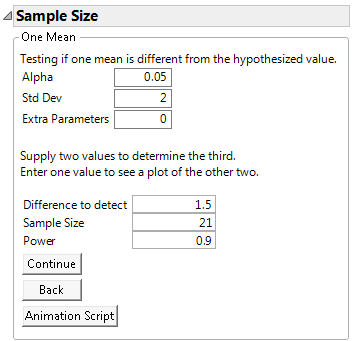
In this initial example, you would like to design an experiment that has 90% power to detect a difference of 1.5 seconds at a significance level of α = 0.05. Use the One Sample Mean calculator to calculate the number of samples you need to test.
|
1.
|
Select DOE > Design Diagnostics > Sample Size and Power.
|
|
2.
|
Click the One Sample Mean button.
|
|
3.
|
Leave Alpha set to 0.05.
|
|
4.
|
Enter 2 for Std Dev.
|
|
5.
|
Leave Extra Parameters set to 0.
|
|
6.
|
Enter 1.5 for Difference to detect.
|
|
7.
|
Leave Sample Size blank.
|
|
8.
|
Enter 0.9 for Power.
|
|
9.
|
Click Continue.
|
Figure 16.4 One-Sample Mean Calculator
|
1.
|
Select DOE > Design Diagnostics > Sample Size and Power.
|
|
2.
|
Click One Sample Mean.
|
|
3.
|
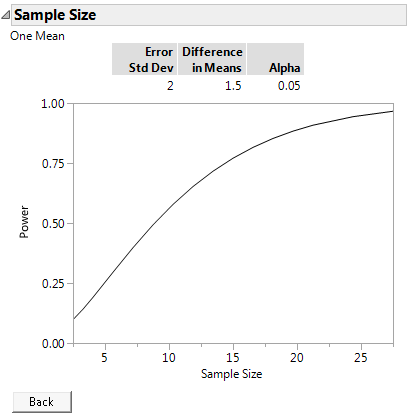
Leave Alpha set to 0.05.
|
|
4.
|
Enter 2 for Std Dev.
|
|
5.
|
Leave Extra Parameters set to 0.
|
|
6.
|
Enter 1.5 for the Difference to detect.
|
|
7.
|
Leave Sample Size blank.
|
|
8.
|
Leave Power blank.
|
|
9.
|
Click Continue to launch the power by sample size plot.
|
Figure 16.5 Power by Sample Size
|
1.
|
Select DOE > Design Diagnostics > Sample Size and Power.
|
|
2.
|
Click One Sample Mean.
|
|
3.
|
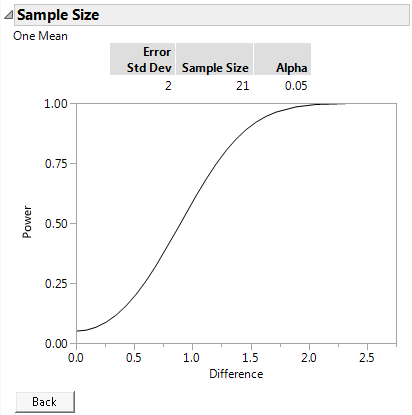
Leave Alpha set to 0.05.
|
|
4.
|
Enter 2 for Std Dev.
|
|
5.
|
Leave Extra Parameters set to 0.
|
|
6.
|
Leave Difference to detect blank.
|
|
7.
|
Enter 21 for Sample Size.
|
|
8.
|
Leave Power blank.
|
|
9.
|
Click Continue.
|
|
1.
|
Select DOE > Design Diagnostics > Sample Size and Power.
|
|
2.
|
Click One Sample Mean.
|
|
3.
|
Leave Alpha set to 0.05.
|
|
4.
|
Enter 2 for Std Dev.
|
|
5.
|
Leave Extra Parameters set to 0.
|
|
6.
|
Enter 1.5 as Difference to detect.
|
|
7.
|
Leave Sample Size blank.
|
|
8.
|
Leave Power blank.
|
|
9.
|
Click Animation Script.
|
Figure 16.7 Initial Animation Script to Illustrate Power
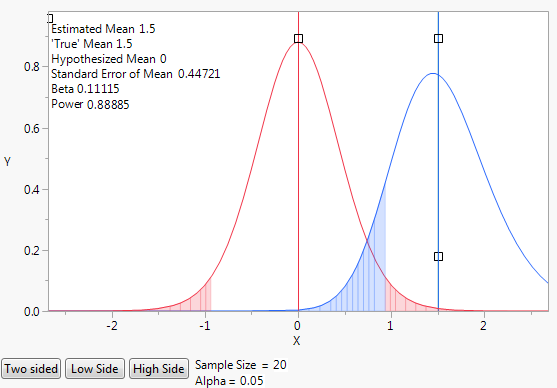
The initial animation plot shows two t-density curves:
|
–
|
The red curve shows the t-distribution when the true mean is zero.
|
|
–
|
The blue curve shows the t-distribution when the true mean is 1.5, which is the difference to be detected.
|
By default, the animation shows a two sided test. Use the Two Sided, Low Side, and High Side buttons to toggle between not equal, less than, or greater than alternative hypotheses.