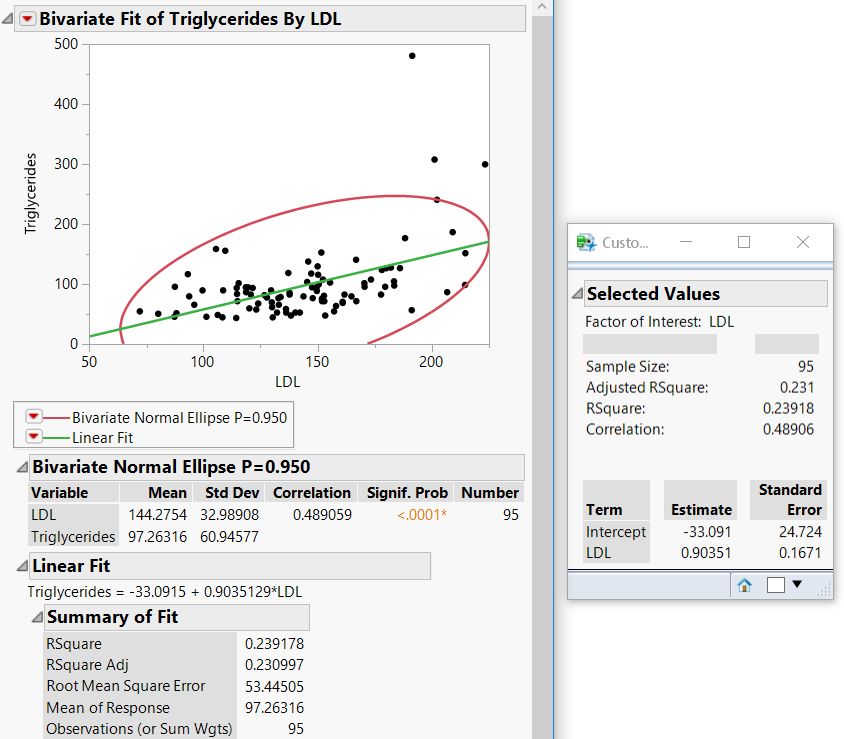
Extract Values from Reports.jsl performs a Bivariate analysis and shows results such as the sample size, RSquare, and Correlation in a new report window. Figure 16.4 shows the Bivariate report along with the customized report, though the Bivariate report window closes after the script is finished.
/* Scenario: How do you capture specific results of an analysis
in a report using JSL?
The JMP platforms in the Analyze and Graph menus contain two objects
known as the analysis and report layers.
Messages are sent to the analysis layer that generate the desired results.
This script performs a Bivariate analysis and shows results
such as the sample size, RSquare, and Correlation in a new report window.
*/
sd = Open( "$SAMPLE_DATA/Lipid Data.JMP" );
biv = Bivariate( // biv is the analysis layer.
Y( :Triglycerides ),
X( :LDL ),
Density Ellipse( 0.95, {Line Color( {213, 72, 87} )} ),
Fit Line( {Line Color( {57, 177, 67} )} ),
);
// Make sure the second Outline Box (called "Correlation")
// in the Bivariate report is open. You can then see which content
// is extracted into the Custom report.
report(biv) [Outline Box( 2 )] << Close( 0 );
reportbiv = biv << Report; // reportbiv is the report layer.
// The density ellipse is generated first.
// Extract the correlation coefficient.
corrvalue = reportbiv[Outline Box( 2 )][Number Col Box( 3 )] << Get( 1 );
// ...followed by Fit Line
// Extract the numeric values from the Summary of Fit report
// and place them in a matrix.
sumfit = reportbiv[Outline Box( 4 )][Number Col Box( 1 )] << Get as Matrix;
// Extract the values of RSquare and AdjRSquare as one by one matrices.
rsquare = sumfit[1];
adjrsq = sumfit[2];
avg = sumfit[4];
samplesize = sumfit[5];
// Extract the first column of the Parameter.
// Estimates report as two objects.
term = reportbiv[Outline Box( 7 )][String Col Box( 1 )] << Get();
// Clone the report layer as a String Col Box.
cloneterm = reportbiv[Outline Box( 7 )][String Col Box( 1 )] << Clone Box;
// Extract the Parameter Estimates values as a matrix.
est = reportbiv[Outline Box( 7 )][Number Col Box( 1 )] << Get as Matrix;
// Extract the Standard Error values as a matrix.
stde = reportbiv[Outline Box( 7 )][Number Col Box( 2 )] << Get as Matrix;
dvalues = [];
dvalues = samplesize |/ adjrsq |/ rsquare |/ corrvalue;
sfactor = term[2];
dlg = New Window( "Custom Report",
Outline Box( "Selected Values",
/* The Lineup box defines a two-column layout, each of which contains
a Text Box. */
Lineup Box( N Col( 2 ),
Text Box( "Factor of Interest: " ),
Text Box( sfactor ), ),
tb = Table Box(
/* Display an empty string in the first column
and the text in the second column. */
String Col Box( " ",
{"Sample Size: ", "Adjusted RSquare: ", "RSquare: ",
"Correlation:"}
),
// Insert a 30 pixel x 30 pixel spacer between the columns.
Spacer Box( Size( 30, 30 ) ),
,
/* Display an empty string in the first column
and the dvalues in the second column. */
Number Col Box( " ", dvalues )
),
// Insert a 1 x 30 spacer.
Spacer Box( Size( 0, 30 ) ),
,
Table Box(
/* Display the cloned String Col Box followed by a spacer.
Then insert the Parameter Estimates and Standard Error values. */
CloneTerm,
Spacer Box( Size( 10, 0 ) ),
,
Number Col Box( "Estimate", est ),
Spacer Box( Size( 10, 0 ) ),
,
Number Col Box( "Standard Error", stde )
)
)
);
tb << Set Shade Headings( 0 ); // Turn off shaded table headings.
tb << Set Heading Column Borders( 0 ); // Turn off table column borders.
Close( sd ); // Close the data table.
Figure 16.4 Customized Report from the Bivariate Analysis