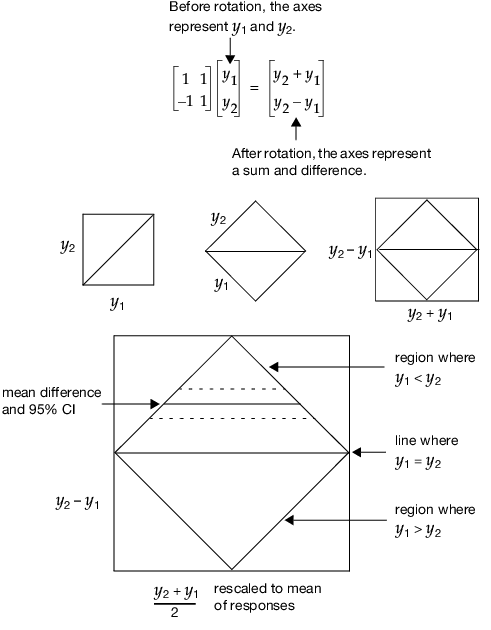
The primary graph in the platform is a Tukey mean-difference (Cleveland 1994, p. 130), which plots the difference of the two responses on the vertical axis against the mean of the two responses on the horizontal axis. This graph is the same as a scatterplot of the two original variables, but turned 45 degrees. A 45 degree rotation and rescaling turns the original coordinates into a difference and a mean.