This example uses the Hurricanes.jmp sample data table, which contains data on hurricanes that have affected the east coast of the United States. Adding a background map helps you see the areas the hurricanes affected. A script has been developed for this example and is part of the data table.
|
1.
|
|
2.
|
In the Table panel, click the green triangle next to the Bubble Plot script.
|
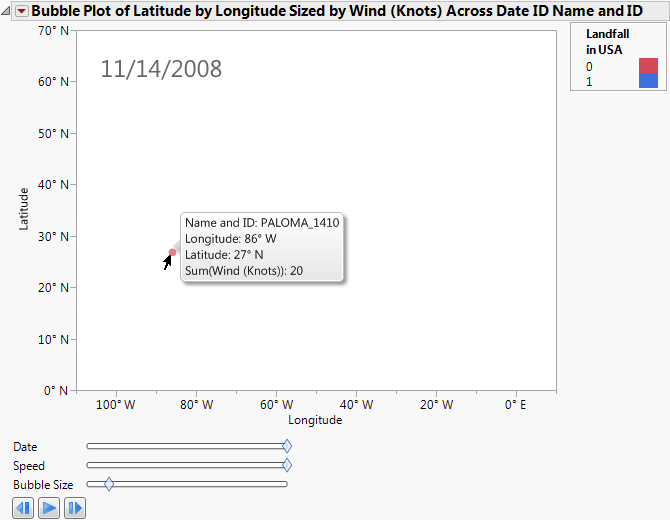
Figure 14.27 Bubble Plot of Hurricanes.jmp
|
5.
|
Right-click the graph and select Background Map. The Set Background Map window appears (Figure 14.12).
|
|
6.
|
Figure 14.28 Bubble Plot of Hurricanes.jmp with Background Map
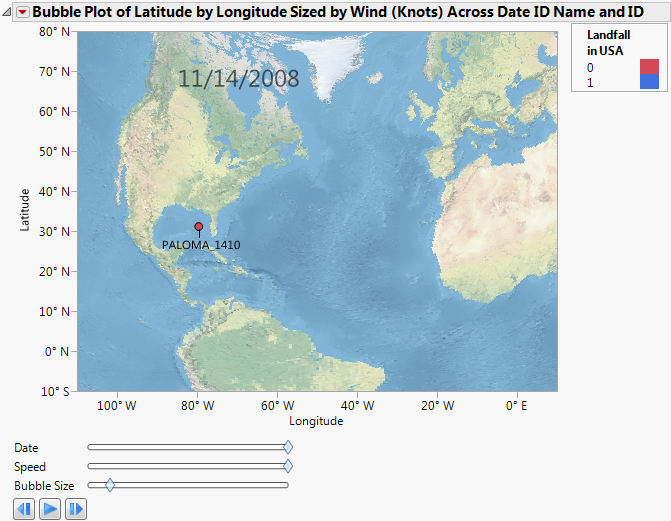
Now the coordinates make geographic sense. Click Run to view the animation of the hurricane data moving over the background map. Experiment with different options and view the displays. Adjust the axes or use the zoom tool to change what part of the world you are viewing. The map adjusts as the view does. You can also right-click the graph and select Size/Scale->Size to Isometric to get the aspect ratio of your graph to be proportional.
The next example uses the Katrina Data.jmp sample data table, which contains data on hurricane Katrina such as latitude, longitude, date, wind speed, pressure, and status. Adding a background map helps you see the path the hurricane took and impact on land based on size and strength. A script has been developed for this example and is part of the data table.
|
1.
|
|
2.
|
|
3.
|
|
4.
|
|
5.
|
|
6.
|
|
7.
|
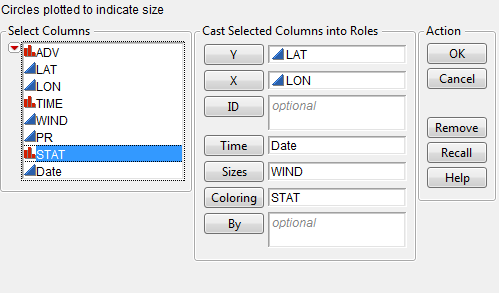
Figure 14.29 Bubble Plot Setup of Katrina Data.jmp
|
8.
|
Click OK.
|
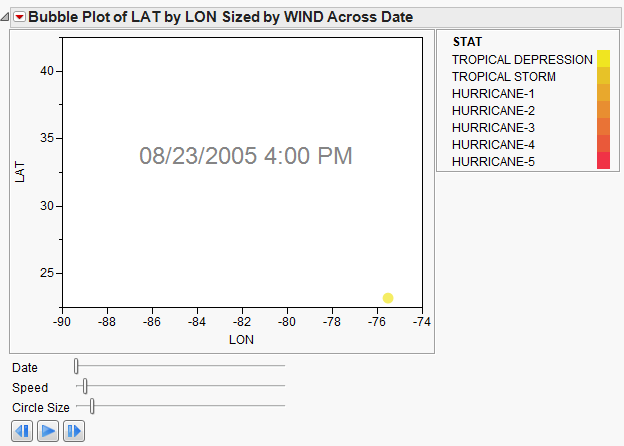
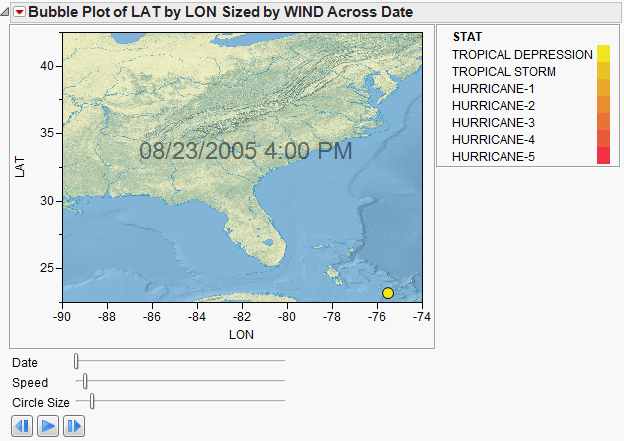
Figure 14.30 Bubble Plot of Katrina Data.jmp
|
9.
|
Right-click the graph and select Background Map. The Set Background Map window appears.
|
|
10.
|
Figure 14.31 Bubble Plot of Katrina Data.jmp with Background Map
|
11.
|
Right-click the X axis (LON) and select Axis Settings. The X Axis Specification window appears.
|
|
12.
|
|
13.
|
|
14.
|
Click OK.
|
|
15.
|
|
16.
|
Figure 14.32 Bubble Plot of Katrina Data.jmp with Background Map
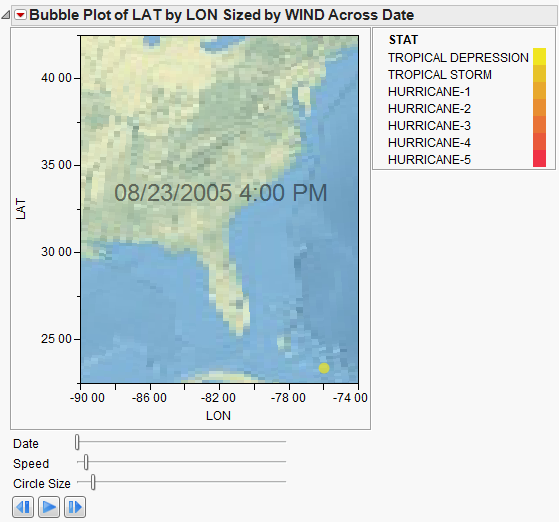
Click Run to view the animation of the hurricane data moving over the background map. You can manipulate the speed and the bubble size. Experiment with different options and view the displays. Adjust the axes or use the zoom tool to change what part of the area you are viewing. Add boundaries to the states. The map adjusts as the view does.