Clicking Make Table creates a data table that contains the runs for your experiment. The example in Figure 11.11 shows a full factorial design with five center points for three factors: X1 (a two-level continuous factor), X2 (a three-level continuous factor), and X3 (a two-level categorical factor). The design uses the default values for the factor levels. The center points are in rows 7, 8, 12, 14, and 17. See Pattern Column.
Figure 11.11 Design Data Table
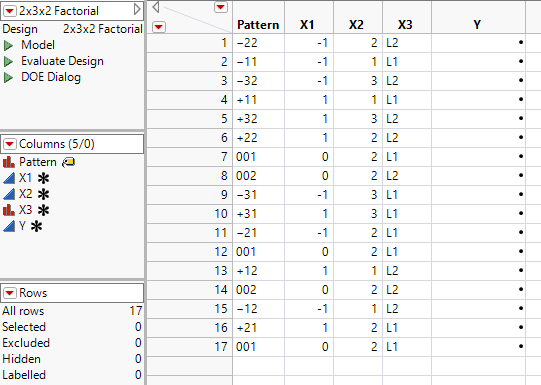
The Pattern column contains entries that summarize the run in the given row. You can use Pattern as a label variable in plots.