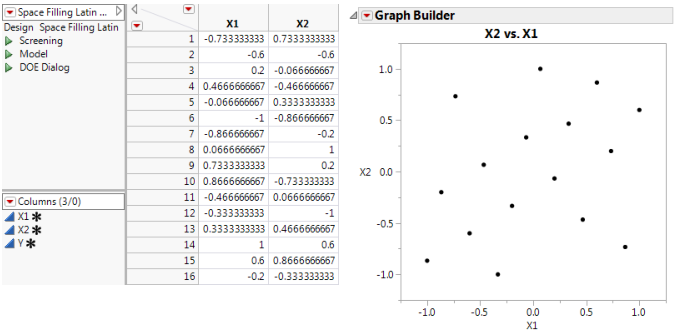
However, as the example in Figure 20.20 shows, the Latin Hypercube design might not provide you with optimal space filling properties. This example is a two-factor 16 run Latin Hypercube with factor level settings set between -1 and 1. The plot of the two factors shows that this design has regions that are missing coverage. In particular, there is poor coverage for X1 near 0 and X2 near -1.
Figure 20.20 Two-factor Latin Hypercube Design
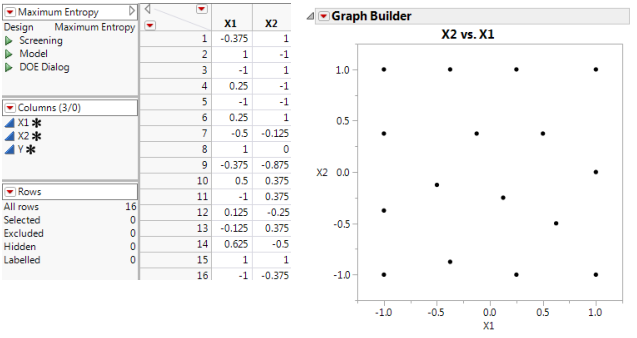
The Maximum Entropy design is an alternative to the Latin Hypercube design for computer experiments. The Maximum Entropy design optimizes a measure of the amount of information contained in an experiment. See the technical note below. With the factor levels set between -1 and 1, the two-factor Maximum Entropy design shown in Figure 20.21 covers the region better than the Latin hypercube design in Figure 20.20. The space-filling property of the design improves as the number of runs increases.
Figure 20.21 Two-Factor Maximum Entropy Design
Technical Maximum Entropy designs maximize the Shannon information (Shewry and Wynn (1987)) of an experiment, assuming that the data come from a normal (m, s2 R) distribution, where
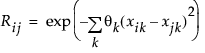
is the correlation of response values at two different design points, xi and xj. Computationally, these designs maximize |R|, the determinant of the correlation matrix of the sample. If xi and xj are far apart, then Rij approaches zero. If xi and xj are close together, then Rij is near one.