|
•
|
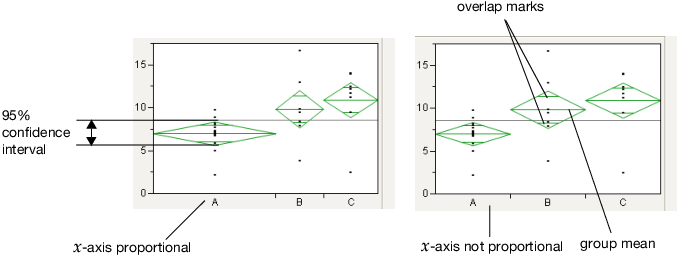
If the X-Axis proportional option is selected, the horizontal extent of each group along the x-axis (the horizontal size of the diamond) is proportional to the sample size for each level of the X variable. Therefore, the narrower diamonds are usually taller, because fewer data points results in a wider confidence interval.
|
|
•
|
Overlap marks appear as lines above and below the group mean. For groups with equal sample sizes, overlapping marks indicate that the two group means are not significantly different at the given confidence level. Overlap marks are computed as group mean ±
 . Overlap marks in one diamond that are closer to the mean of another diamond than that diamond’s overlap marks indicate that those two groups are not different at the given confidence level. . Overlap marks in one diamond that are closer to the mean of another diamond than that diamond’s overlap marks indicate that those two groups are not different at the given confidence level. |
|
•
|
The mean diamonds automatically appear when you select the Means/Anova/Pooled t or Means/Anova option from the platform menu. However, you can show or hide them at any time by selecting Display Options > Mean Diamonds from the red triangle menu.
|