In the following example from Atkinson and Donev (1992), you create a design for an experiment involving both mixture factors and process factors. The design is an 18-run design that is balanced with respect to the levels of a categorical factor. The design enables you to fit a full response surface. You use Design Evaluation plots and results to examine the relative prediction variance of the design.
|
•
|
The response is Damping, which measures the electromagnetic damping of an acrylonitrile powder.
|
|
–
|
CuSO4 (copper sulphate), ranging from 0.2 to 0.8
|
|
–
|
Na2S2O3 (sodium thiosulphate), ranging from 0.2 to 0.8
|
|
–
|
Glyoxal (glyoxal), ranging from 0 to 0.6
|
|
•
|
The nonmixture environmental factor of interest is Wavelength (the wavelength of an electromagnetic wave) at three levels denoted L1, L2, and L3.
|
Wavelength is a continuous variable. However, the researchers were interested only in predictions at three specific wavelengths. For this reason, you treat Wavelength as a categorical factor with three levels.
|
1.
|
Select DOE > Custom Design.
|
|
2.
|
|
3.
|
The goal is set to None because the authors of the study do not mention how much damping is desirable.Select Help > Sample Data Library and open Design Experiment/Donev Mixture Factors.jmp.
|
4.
|
From the Custom Design red triangle menu, select Load Factors.
|
Figure 4.52 Responses Outline and Factors Outline
|
5.
|
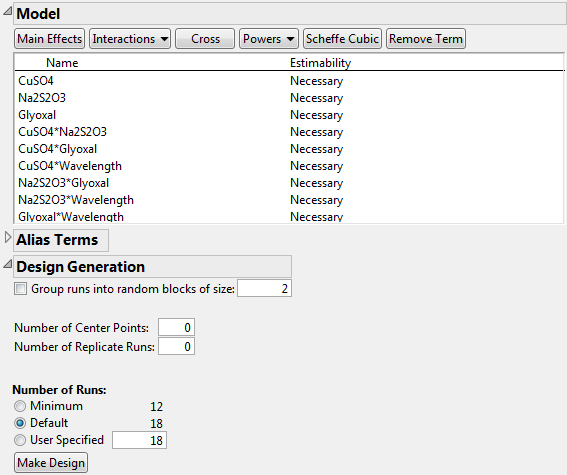
In the Model outline, click Interactions > 2nd.
|
An informational JMP Alert window reminds you that JMP removes the main effect terms for non-mixture factors that interact with all the mixture factors. This means that the main effect of Wavelength is removed, but all two-way interactions of mixture factors with Wavelength are added.
|
6.
|
Click OK to dismiss the message.
|
The effects in the Model outline define a response surface model in the mixture ingredients along with the additive effect of the wavelength. See Scheffé (1958).
Figure 4.53 Model and Design Generation Outlines
Note: Setting the Random Seed in step 8 and Number of Starts in step 9 reproduces the exact results shown in this example. In constructing a design on your own, these steps are not necessary.
|
8.
|
(Optional) From the Custom Design red triangle menu, select Set Random Seed, type 858576648, and click OK.
|
|
9.
|
(Optional) From the Custom Design red triangle menu, select Number of Starts, type 10, and click OK.
|
|
10.
|
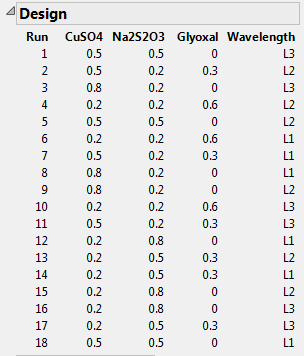
Click Make Design.
|
Figure 4.54 Design Outline Showing 18-Run Design
|
1.
|
Figure 4.55 Prediction Variance Profile for 18-Run Design
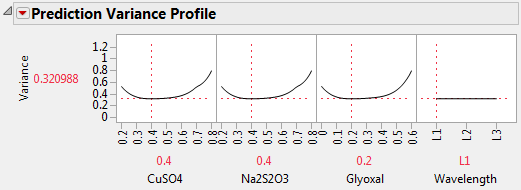
Move the slider for Wavelength to verify that the relative prediction variance profiles for the mixture factors do not change across the levels of Wavelength. Move the slider for any one of the mixture factors. The sliders for the other two mixture factors adjust to make the mixture ingredients sum to one. Notice that the smallest relative prediction variances occur near the center settings for the mixture factors.
|
2.
|
From the Prediction Variance Profile red triangle menu, select Maximize Variance.
|
|
3.
|
Open the Fraction of Design Space Plot outline.
|
Figure 4.56 Fraction of Design Space Plot for 18-Run Design
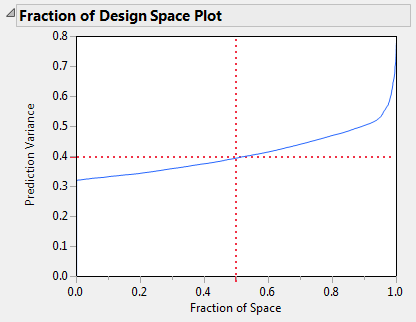
Over the entire design space, the relative prediction variance is below 0.8. The minimum relative prediction variance is about 0.32. As seen in Figure 4.55, the minimum occurs near the center settings for the mixture factors.
|
4.
|
Open the Design Diagnostics outline.
|
Figure 4.57 Design Diagnostics Outline for 18-Run Design
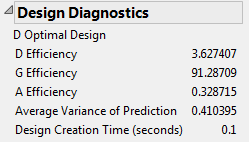
The design is optimal relative to the D-optimality criterion, even though its D-efficiency is very low (3.6%). Because mixture designs are far from orthogonal due to the mixture constraint, they typically have very low D-efficiencies. The Average (relative) Variance of Prediction is 0.410395. This is consistent with the Fraction of Design Space plot in Figure 4.56.