Note: This option appears only if you specify the Macros > Mixture Response Surface option for an effect. For complete details, see Mixture Profiler in the Profilers book.
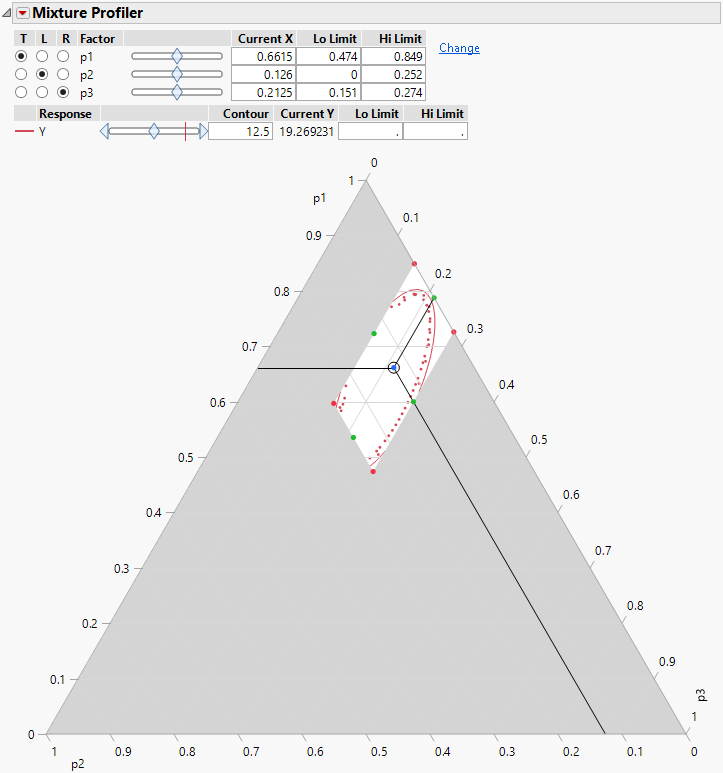
Figure 2.52 shows the Mixture Profiler for the model in the Plasticizer.jmp sample data table. Run the Model data table script and then select Factor Profiling > Mixture Profiler from the report’s red triangle menu. You modify plot axes for the factors by selecting different radio buttons at the top left of the plot. The Lo and Hi Limit columns at the upper right of the plot let you enter constraints for both the factors and the response.
Figure 2.52 Mixture Profiler