In this example, you examine pizza choices where three attributes, with two levels each, are presented to the respondents. The study was designed such that the respondents had to make a choice. The analysis uses three data tables: Pizza Profiles.jmp, Pizza Responses.jmp, and Pizza Subjects.jmp..Although you can always arrange your data into a single table, a multi-table approach can be more convenient than a one table analysis when you have additional profile and subject variables that you want to include in your analysis.
|
1.
|
Select Help > Sample Data Library and open Pizza Profiles.jmp, Pizza Responses.jmp, and Pizza Subjects.jmp.
|
|
–
|
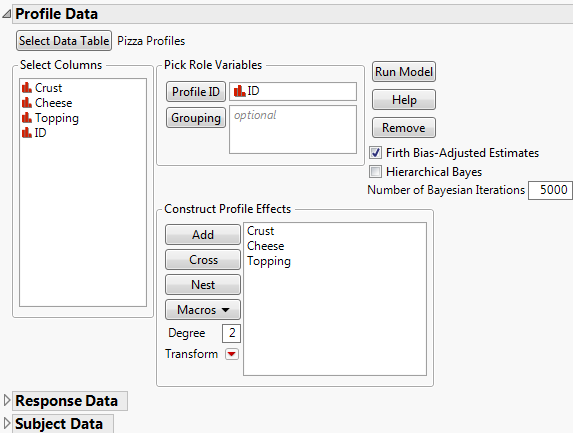
The profile data table, Pizza Profiles.jmp, lists all the pizza choice combinations that you want to present to the subjects. Each choice combination is given an ID.
|
|
–
|
The responses data table, Pizza Responses.jmp, contains the design and results. For the experiment, each subject is given four choice sets, where each choice set consists of two choice profiles (Choice1 and Choice2). The subject selects a preference (Choice) for each choice set. For information about how to construct a choice design, see Choice Designs in the Design of Experiments Guide. Notice that each value in the Choice column is an ID value in the Profile data table that contains the attribute information.
|
|
–
|
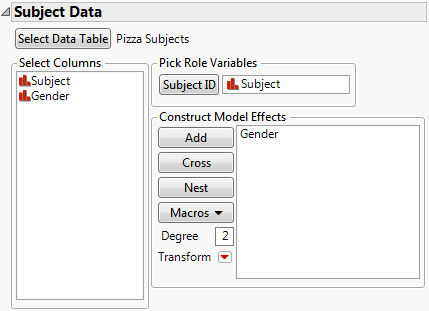
The subjects data table, Pizza Subjects.jmp, includes a Subject ID column and a single characteristic of the subject, Gender. Each value of Subject in the Pizza Subjects.jmp data table corresponds to values in the Subject column in the Pizza Responses.jmp data table.
|
|
2.
|
Select Analyze > Consumer Research > Choice to open the launch window.
|
|
3.
|
From the Data Format menu, select Multiple Tables, Cross-Referenced.
|
|
4.
|
Click Select Data Table under Profile Data.
|
|
5.
|
|
6.
|
|
7.
|
Figure 5.5 Profile Data
|
8.
|
|
9.
|
|
–
|
|
–
|
|
–
|
Figure 5.6 Response Data Window
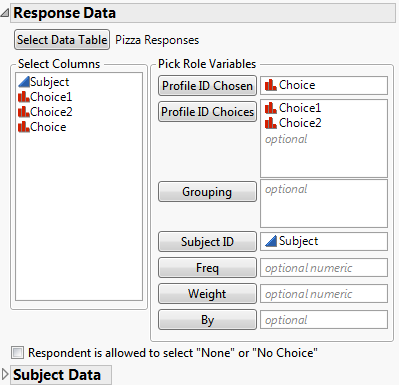
Choice1 and Choice2 are the profiles presented to a subject in each of four choice sets. The Choice column contains the chosen preference between Choice1 and Choice2.
|
11.
|
Click the disclosure icon next to Subject Data to open the outline and click Select Data Table.
|
|
12.
|
|
13.
|
|
14.
|
Figure 5.7 Subject Data Window
|
15.
|
Click Run Model.
|
Figure 5.8 Choice Model Results
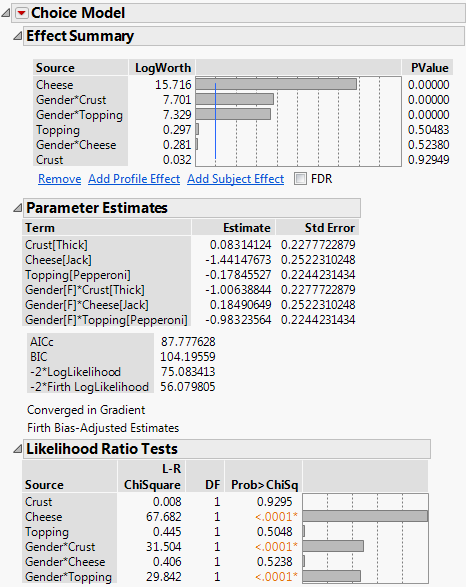
Six effects are entered into the model. The effects Crust, Cheese, and Topping are product attributes. The interaction effects, Gender*Crust, Gender*Cheese, and Gender*Topping are subject-effect interactions with the attributes. These interaction effects enable you to construct products that meet market-segment preferences.
The Effect Summary and Likelihood Ratio Tests reports show strong interactions between Gender and Crust and between Gender and Topping. Notice that the main effects of Crust and Topping are not significant. If you had not included subject-level effects, you might have overlooked important information relative to market segmentation.
|
1.
|
Click the Choice Model red triangle and select Utility Profiler.
|
|
2.
|
Click the red triangle next to Utility Profiler and select Optimization and Desirability > Desirability Functions.
|
Figure 5.9 Utility Profiler with Desirability Function
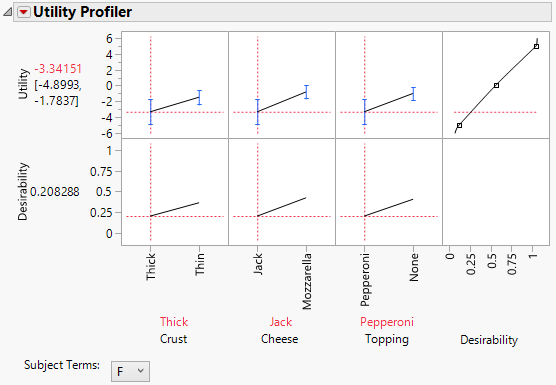
A desirability function that maximizes utility is added to the profiler. See Profiler in the Profilers book.
|
3.
|
Click the red triangle next to Utility Profiler and select Optimization and Desirability > Maximize Desirability.
|
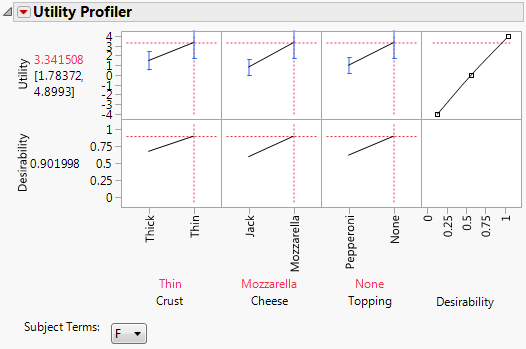
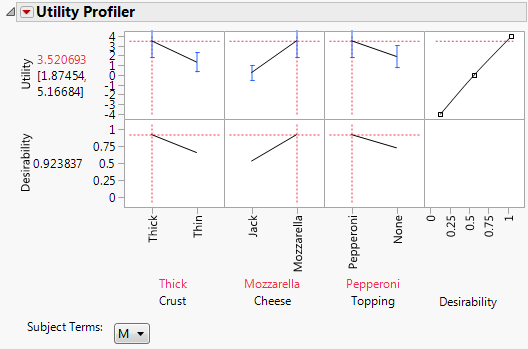
Figure 5.11 Utility Profiler with Male Level Factor Setting