Shows or hides the specification limits on the chart. Appears only if the data table has a Spec Limits column property. Spec Limits in the Using JMP book includes details about adding this column property.
Enables you to enter control limits for tests. After you click OK in the Set Control Limits window, the specified control limits are set uniformly across groups. Select this option again to remove the specified control limits.
Adds a dispersion chart to the chart area. Change the chart type with the Points options. A dispersion chart illustrates the variation in the data by plotting one of many forms of dispersion, including the range, standard deviation, or moving range. Available only for Variables chart types.
Enables you to select which statistical control tests to enable. For more information about tests, see Tests. Available only for Variables and Attribute chart types.
Note: Move your cursor over a flagged point on the chart to see a description of the test that failed.
Enables you to select which Westgard statistical control tests to enable. Because Westgard rules are based on sigma and not the zones, they can be computed without regard to constant sample size. For more information about tests, see Westgard Rules. Available only for Variables and Attribute chart types.
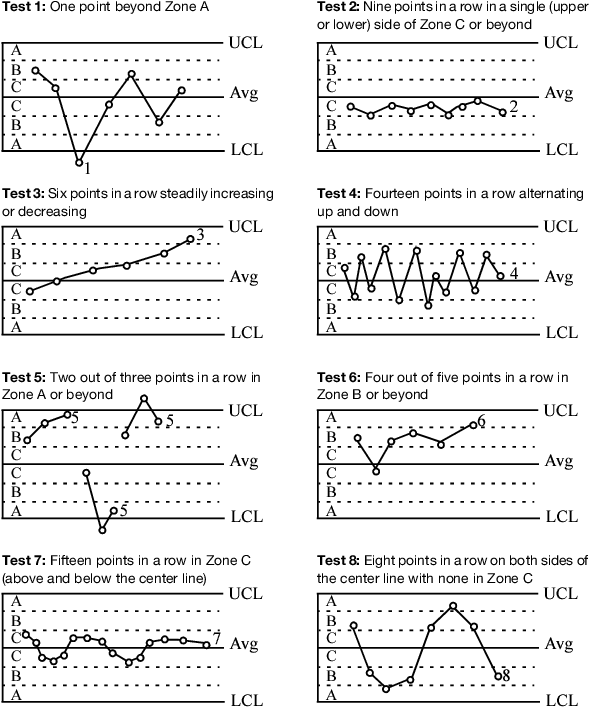
The Warnings option in the right-click menu or on the left hand side of the window displays a submenu for Tests selection. You can select one or more tests for special causes (Western Electric rules) from the menu. Nelson (1984) developed the numbering notation used to identify special tests on control charts. The tests work with both equal and unequal sample sizes.
Tip: To add or remove several tests at once, select or deselect the tests in the Control Panel under Warnings > Tests.
Table 2.8 lists and interprets the eight tests, and Figure 2.7 illustrates the tests. The following rules apply to each test:
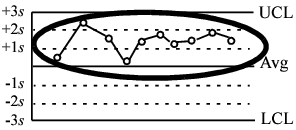
Figure 2.6 Zones for Western Electric Rules
|
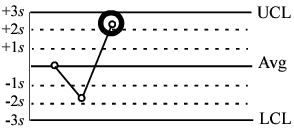
Detects a shift in the mean, an increase in the standard deviation, or a single aberration in the process. For interpreting Test 1, any dispersion chart (R-, S-, or MR-) can be used to rule out increases in variation.
|
||
Westgard rules are implemented under the Westgard Rules submenu of the Warnings option when you right-click on a chart or on the left hand side of the window. The different tests are abbreviated with the decision rule for the particular test. For example, 1 2s refers to a test where one point is two standard deviations away from the mean.
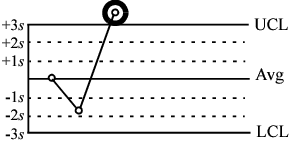
Rule 1 2S is commonly used with Levey-Jennings charts, where control limits are set 2 standard deviations away from the mean. The rule is triggered when any one point goes beyond these limits.
Rule 1 3S refers to a rule common to Levey-Jennings charts where the control limits are set 3 standard deviations away from the mean. The rule is triggered when any one point goes beyond these limits.
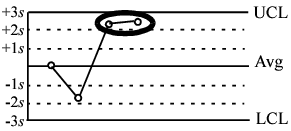
Rule 2 2S is triggered when two consecutive control measurements are farther than two standard deviations from the mean.
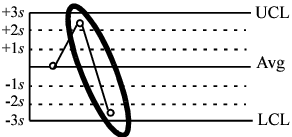
Rule R 4S is triggered when one measurement is greater than two standard deviations from the mean and the previous measurement is greater than two standard deviations from the mean in the opposite direction such that the difference is greater than 4 standard deviations.
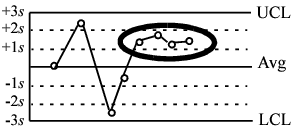
Rule 4 1S is triggered when four consecutive measurements are more than one standard deviation from the mean.
Rule 10 X is triggered when ten consecutive points are on one side of the mean.