Use the Prediction Graph tab to predict the Y variable for a specified Time value. Figure 6.16 shows the Prediction Plot tab.
Figure 6.16 Prediction Plot Tab
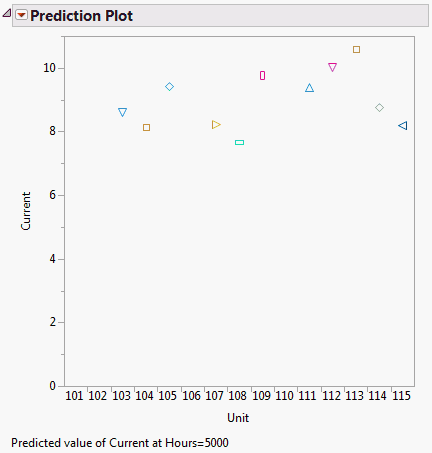
For the GaAs Laser example, no data was collected after 4000 hours. If you want to predict the percent increase in operating current after 5000 hours, enter 5000 and click Go. A plot is produced showing the estimated percent decrease after 5000 hours for all the units. See Figure 6.17.
Figure 6.17 Prediction Plot