For example, consider a study by Cole and Grizzle (1966). The results are in the Dogs.jmp table in the sample data folder. Sixteen dogs are assigned to four groups defined by variables drug and dep1, each having two levels. The dependent variable is the blood concentration of histamine at 0, 1, 3, and 5 minutes after injection of the drug. The log of the concentration is used to minimize the correlation between the mean and variance of the data.
|
1.
|
|
2.
|
Select Analyze > Fit Model.
|
|
3.
|
|
4.
|
|
5.
|
For Personality, select Manova.
|
|
6.
|
Click Run.
|
|
7.
|
Time should be entered for YName. If you check the Univariate Tests Also check box, the report includes univariate tests, which are calculated as if the responses were stacked into a single column.
|
8.
|
Click OK.
|
Figure 8.9 Repeated Measures Window
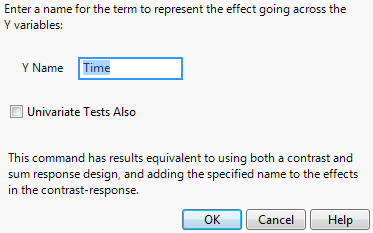
Table 8.1 shows how the multivariate tests for a Sum and Contrast response designs correspond to how univariate tests would be labeled if the data for columns LogHist0, LogHist1, LogHist3, and LogHist5 were stacked into a single Y column, with the new rows identified with a nominal grouping variable, Time.
The between-subjects analysis is produced first. This analysis is the same (except titling) as it would have been if Sum had been selected on the popup menu.
The within-subjects analysis is produced next. This analysis is the same (except titling) as it would have been if Contrast had been selected on the popup menu, though the within-subject effect name (Time) has been added to the effect names in the report. Note that the position formerly occupied by Intercept is Time, because the intercept term is estimating overall differences across the repeated measurements.