Figure 4.8 Partition Report for a Continuous Response
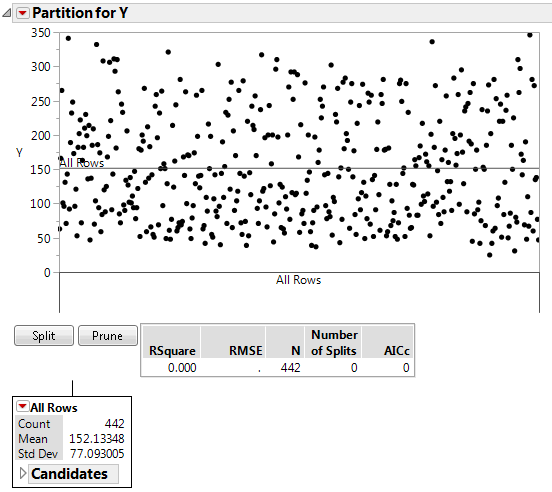
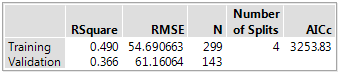
Figure 4.9 Summary Report for a Continuous Response
The corrected Akaike’s Information Criterion. For more details, see Likelihood, AICc, and BIC in the Fitting Linear Models book.
Figure 4.10 Terminal Node Report for a Continuous Response
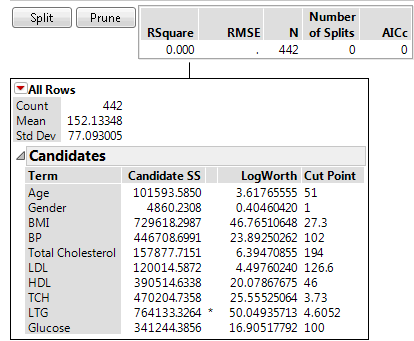
The LogWorth statistic, defined as -log10(p-value). The optimal split is the one that maximizes the LogWorth. See Statistical Details for the Partition Platform for additional details.
The optimum split is noted by an asterisk. However, there are cases where the Candidate SS is higher for one variable, but the Logworth is higher for a different variable. In this case > and < are used to point in the best direction for each variable. The asterisk corresponds to the condition where they agree. See Statistical Details for the Partition Platform for details.