Row states change how JMP works with your data. Table 8.5 explains each row state. Remember that you can use several row states at once to get the combination of effects that you want.
 |
If rows are excluded, JMP omits them from calculations for statistical analyses (text reports and charts). Results are the same as if the data was not entered. However, points are still included in plots. (To omit points from plots, use Hide. To omit points from all results, use both Exclude and Hide.)
|
 |
If rows are hidden, JMP does not show them in plots. However, the rows are still included in text reports and charts. (To omit points from reports and charts, use Exclude. To omit points from all results, use both Exclude and Hide.)
|
 |
|
 |
|
 |
|
 |
Note: For row state messages, omitting the argument toggles the option: if the option is off, the message turns it on, and if the option is on, the message turns it off. You can also use the "toggle", "switch", or "flip" argument, as in r << Exclude( "toggle" ).
Table 8.6 shows a comparison chart of the different row state functions, so that you can see which functions convert row states to numbers and numbers to row states. It also includes the numbers that you can use with each function.
 |
 |
|||
Excluded State(n) |
|
Excluded(rowstate) |
||
Hidden State(n) |
|
Hidden(rowstate) |
||
Labeled State(n) |
|
Labeled(rowstate) |
||
Selected State(n) |
|
Selected(rowstate) |
||
Marker State(n) |
|
Marker Of(rowstate) |
||
Color State(n) |
|
Color Of(rowstate) |
||
Hue State(n) |
 |
|||
Shade State(n) |
 |
To assign a row state using JSL, use Select Where to indicate which rows are affected, and then specify which row state to assign to the rows. In the following example, marker type 5 (a triangle) is assigned to rows in which sex is “F”.
dt = Open( "$SAMPLE_DATA/Big Class.jmp" );
dt << Select Where( :sex == "F" ) << Markers( 5 );
|
3.
|
dt = Open( "$SAMPLE_DATA/Big Class.jmp" );
dt << New Column( "Row State",
Row State,
Set Formula( If( :sex == "F", Marker State( 4 ) ) )
);
Column( "Row State" ) << Copy To Row States();
A row state column is a dedicated column that stores row state information, but does not put the information into effect. You can then use For Each Row to put the row state column into effect. For more information about row state columns, see Row State Columns in the Using JMP book.
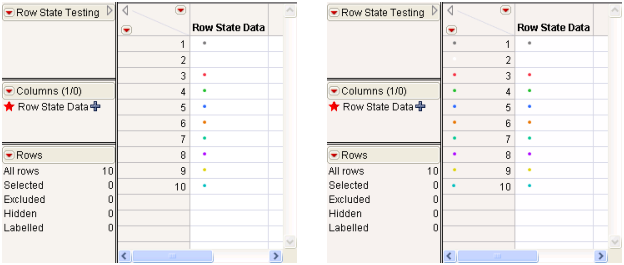
dt = New Table( "Row State Testing" );
dt << New Column( "Row State Data", Row State, Set Formula( Color State( Row() ) ) );
dt << Add Rows( 10 );
For Each Row( Row State() = :Row State Data );
This action replaces any row states in effect with the row state combination from the row state column. For details about how to change selected attributes of a row state without changing or canceling others, see Set One Characteristic and Cancel Others.
From JSL, you can set or get row states directly using the Row State function. You can set or get the state for row n with Row State(n). If you do not supply an argument, you set or get the current row. To work with all rows, either use a For Each Row loop or work with formula columns.
Row State( 1 ) = Color State( 3 ); // make row 1 red
Row() = 8; Row State() = Color State( 3 ); // make the 8th row red
For Each Row( Row State() = Color State( 3 ) ); // make each row red
dt1 = Open( "$SAMPLE_DATA/Big Class.jmp" );
dt2 = Open( "$SAMPLE_DATA/San Francisco Crime.jmp" );
Row State( dt1, 1 ) = Color State( 3 ); // make row 1 red;
x = Row State( 5 ); // put the row state of row 5 into x
x = Row State(); // row state of current row
Be careful whether you set every aspect of Row State() or just one aspect of it, such as Color Of( Row State() ). To see how this works, first color and mark all the rows:
dt1 = Open( "$SAMPLE_DATA/Big Class.jmp" );
For Each Row(
Row State() = Combine States( Color State( Row() ), Marker State( Row() ) ) );
Color Of( Row State( 1 ) ) = 3; // make row 1 red without changing marker
Row State( 1 ) = Color State( 5 ); // make row 1 blue and removes its marker
New Column( "rscol", Set Formula( Row State() ) );
For Each Row( rscol = Row State() );
Column "rscol" changed to type Row State to match formula.
New Column( "rscol2",
Set Formula(
Combine States(
Color State( Color Of() ),
Excluded State( Excluded() ),
Hidden State( Hidden() ),
Labeled State( Labeled() ),
Marker State( Marker Of() ),
Selected State( Selected() )
)
)
);
Color Of( Row State( i ) ) = 3; // change color to red for row i
Selected( Row State( i ) ) = 1; // select the ith row state and set to 1
Functions that take number arguments and either return states or accept state assignments all have the word “State” in their names: Row State, As Row State, Color State, Combine States, Excluded State, Hidden State, Hue State, Labeled State, Marker State, Selected State, Shade State.
Functions that take row state arguments (and assume that the argument Row State() if none is given) and functions that return or are set to numbers are either one word, or their second word is “Of”: Color Of, Excluded, Hidden, Labeled, Marker Of, Selected.
Table 8.6 is a helpful comparison chart for these functions.
Copy From Row States
Add From Row States
Copy To Row States
Add To Row States
dt = Open( "$SAMPLE_DATA/Big Class.jmp" );
dt << New Column( "Row State Data", Row State, Set Formula( Color State( Row() ) ) );
dt << Add Rows( 10 );
For Each Row( Row State() = :Row State Data );
Row State( 1 ); // returns row state for row 1
Row() = 8; Row State(); // returns row state for current (8th) row
For Each Row( Print( Row State()) ); // returns the row states for each row
To get a row state and store it in a global, place Row State() on the right side of an assignment. Add the following lines to the preceding script:
::x = Row State( 1 ); // put the row state of row 1 in x, a global
Row() = 8; ::x = Row State(); // put the row state of the 8th row in x
Show( x ); // returns x = Color State( 8 )
dt << New Column( "rscol", Row State) ;
For Each Row( :rscol = Row State() );
// puts row states in rscol (a row state column)
x = Selected( Row State() ); // selection index of current row selected
You can get or set many characteristics at once by combining state settings inside Combine States(). You can also get or set each characteristic one at a time, the ultimate row state being the accumulation of characteristics. The following example sets green Y markers for males, but hides them in plots for now. It also sets red X markers for females but shows them in plots.
dt = Open( "$SAMPLE_DATA/Big Class.jmp" );
For Each Row(
If( sex == "M",
/* then */ Row State() = Combine States(
Color State( 4 ), Marker State( 6 ), Hidden State( 1 ) ),
/* else */ Row State() = Combine States(
Color State( 3 ), Marker State( 2 ), Hidden State( 0 ) ) ) );
Row State( 6 );
Combine States(Hidden State(1), Color State(4), Marker State(6))
Notice that JMP returns a Combine State() combination. This is because a row state datum is not just the state of one characteristic, such as color, but the cumulative state of all the characteristics that have been set: exclusion, hiding, labeling, selection, markers, colors, hues, and shades. A list of such characteristics is called a row state combination.
Just as there can be many row state characteristics in effect, a row state column can have multiple characteristic row states as its values.
In addition to the overall Row State() function for getting or setting all the characteristics of a row state, there are separate functions to get or set one characteristic at a time preemptively. That is, to give a row one characteristic, canceling any other characteristics that might be in effect. The functions that set one characteristic and cancel others are as follows: Color State, Combine States, Excluded State, Hidden State, Hue State, Labeled State, Marker State, Selected State, Shade State.
Row State( 4 ) = Hidden State( 1 );
A row state is not just one characteristic, but many. To work with just one characteristic at a time, use one of the L-value operators with Row State on either side of the equal sign. The side of the equal sign depends on whether you want to get or set a characteristic. There is an L-value operator for each of the following characteristics: Color Of, Excluded, Hidden, Labeled, Marker Of, Selected.
Hidden( Row State( 4 ) ) = 1
::color = Color Of( Row State( 3 ) );
The MakeRowStateHandler message (sent to a data table object) obtains a callback when the row states change. For example,
f = Function( {X}, Show( x ) );
obj = dt << Make Row State Handler( f );
x:[3, 4, 28, 40, 41]
|
•
|
Excluded gets or sets an excluded index. The index is 1 for true or 0 for false, indicating whether each row is excluded.
|
|
•
|
Hidden gets or sets a hidden index, which is 1 for hidden or 0 for not hidden.
|
|
•
|
Labeled gets or sets a labeled index, which is 1 for labeled or 0 for not labeled.
|
|
•
|
Selected gets or sets a selected index, which is 1 for selected or 0 for not selected.
|
Excluded( Row State() ); // returns 1 if current row is excluded, 0 if not
Hidden(); // returns 1 if current row is hidden, 0 if not
Labeled( Row State() ); // returns 1 if current row is labeled, 0 if not
Selected(); // returns 1 if current row is selected, 0 if not
Excluded( Row State() ) = 1; // exclude current row
Hidden() = 0; // unhide current row
Labeled( Row State() ) = 1; // label current row
Selected() = 0; // deselect current row
Remember that these functions assume the argument Row State() if none is given.
Excluded State, Hidden State, Labeled State, and Selected State do the reverse; they get or set a row state condition as true or false according to the argument. Nonzero values set the row state to true, and zero values set it to false. Missing values result in no change of state.
Row State() = Excluded State( 1 ); // change current row state to excluded
Row State() = Hidden State( 0 ); // change current row state to not hidden
Row State() = Labeled State( 1 ); // change current row state to labeled
Row State() = Selected State( 0 );
// change current row state to not selected
Notice that the first two expressions above replace the row state with just the exclusion or just the unhiding, so that any preexisting row state characteristics are lost. More commonly, you would issue the state commands for all of the characteristics that you want inside a Combine States. The following example changes the third row to hidden and a green square marker:
dt = Open( "$SAMPLE_DATA/Big Class.jmp" );
Row State( 3 ) = Combine States(
Color State( 4 ),
Marker State( 3 ),
Hidden State( 1 ) );
Another common way to use a -State command would be in a row state data column whose values could be added to the row state (for cumulative characteristics). The following example excludes each odd numbered row:
dt = Open( "$SAMPLE_DATA/Big Class.jmp" );
dt << New Column( "myExcl",
Row State,
Set Formula( Excluded State( Modulo( Row(), 2 ) ) )
);
For Each Row( Row State() = Combine States( :myExcl, Row State() ) );
Clear Row States() removes row states from the data table. The following script assigns a row state to each row and then removes the row state.
dt = Open( "$SAMPLE_DATA/Big Class.jmp" );
For Each Row( Row State() = Color State( Row() ) );
Wait( 3 ); // pause for demonstration purposes
dt << Clear Row States();
To clear row states for selected rows, select the rows first and then clear the selected row states.
dt = Open( "$SAMPLE_DATA/Big Class.jmp" );
For Each Row( Row State() = Color State( Row() ) );
dt << Select Rows( [ 5 ] );
Wait( 3 ); // pause for demonstration purposes
dt << Clear Selected Row States();
Color Of() returns or sets the color index. The color index is a number from the JMP color map that corresponds to the row state, or a missing value if there is no assigned color.
Color Of( Row State() ); // returns color index for current row
Color Of() = 4; // set current row to Color 4
Similarly, Marker Of returns or sets the marker index. The marker index is a number from the JMP marker map that corresponds to the active marker, or a missing value if there is no assigned marker.
Marker Of(); // returns marker index for current row
Marker Of( Row State() ) = 4; // set current row to Marker 4
Both Color Of() and Marker Of() accept any row state expression or column or Row State() as arguments. They also assume the argument Row State() if none is given (some examples are shown with, and some without).
Color State() and Marker State() are similar to Color Of() and Marker Of(), except they work in the opposite direction. Where the -Of functions turn actual states into indices, the -State functions turn indices into states.
Row State() = Color State( 4 ); // change current row to green
Row State() = Marker State( 4 ); // change current row to the diamond marker
Notice that the last two commands replace the row state with just the color or just the marker, so that any preexisting row state characteristics are lost. More commonly you would issue the -State commands for all the characteristics that you want inside a Combine States(). The following example puts a green square marker in the third row and hides the row:
dt = Open( "$SAMPLE_DATA/Big Class.jmp" );
Row State( 3 ) = Combine States(
Color State( 4 ),
Marker State( 3 ),
Hidden State( 1 ) );
New Window( "Markers",
Graph Box(
FrameSize( 300, 300 ),
Y Scale( -1, 16 ),
X Scale( 0, 7 ),
For(
i = 0;
jj = 15;,
i < 16;
jj >= 0;,
i++;
jj--;, // 16 rows, 2 columns
Marker Size( 3 );
Marker( i, {1, jj + .2} ); // markers 0-15
Marker( i + 16, {4, jj + .2} ); // markers 16-31
Text( {1.5, jj}, "marker ", i ); // marker labels 0-15
Text( {4.5, jj}, "marker ", i + 16 ); // marker labels 16-31
)
)
);
Figure 8.13 JMP Markers
Text Color( 0 );
New Window( "Colors",
Graph Box(
FrameSize( 640, 400 ),
Y Scale( -1, 17 ),
X Scale( -3, 12 ),
k = 0;
For( jj = 1, jj <= 12, jj += 2,
l = 15;
For( i = 0, i <= 15 & k < 85, i++,
thiscolor = Color To RGB( k );
Fill Color( k );
thisfill = 1;
If( thiscolor == {1, 1, 1},
Pen Color( 0 );
thisfill = 0;
,
Pen Color( k )
);
Rect( jj, l + .5, jj + .5, l, thisfill );
Text( {jj - 1, l}, "color ", k );
k++;
l--;
);
);
jj = -2;
color = {"Black", "Gray", "White", "Red", "Green", "Blue", "Orange", "BlueGreen",
"Purple", "Yellow", "Cyan", "Magenta", "YellowGreen", "BlueCyan", "Fuschia", "Black"};
For(
i = 0;
l = 15;, i <= 15 & l >= 0,
i++;
l--;,
Text( {jj, l}, color[i + 1] )
);
) );
Figure 8.14 JMP Colors
Pen Color( {.38,.84,.67} ); // a lovely teal
Hue State and Shade State together are an alternative to Color State for choosing colors. You cannot select black, white, or the shades of gray when you use Hue State. For these, you must use Shade State alone, or Color State.
New Window( "Hues and Shades",
Graph Box(
FrameSize( 600, 300 ),
Y Scale( -3, 3 ),
X Scale( -2, 12 ),
k = 0;
For( h = 0, h < 12, h++,
For( s = -2, s < 3, s++,
myMk = Combine States( Hue State( h ), Shade State( s ), Marker State( 15 ) );
Marker Size( 3 );
Marker( myMk, {h, s} );
)
);
Text( Center Justified, {5, 2.5}, " <--- Hues 0-11 ---> " );
Text( Right Justified,
{-.5, -2}, "Shade -2", {-.5, -2.25}, "(Very dark)",
{-.5, -1}, "Shade -1", {-.5, -1.25}, "(Dark)",
{-.5, 0}, "Shade 0", {-.5, -.25}, "(Basic hue)",
{-.5, 1}, "Shade 1", {-.5, .75}, "(Light)",
{-.5, 2}, "Shade 2", {-.5, 1.75}, "(Very light)"
);
)
);
Figure 8.15 Hues and Shades
There are no -Of functions for Hue and Shade. Color Of returns the equivalent Color State index for a color row state that has been set with Hue State or Shade State. For example, the following example gives rows 4 and 5 the same dark red marker:
Row State( 4 ) = Combine States( Hue State( 0 ), Shade State( -1 ), Marker State( 12 ) );
Row State( 5 ) = Combine States(
Color State( Color Of( Row State( 4 ) ) ),
Marker State( Marker Of( Row State( 4 ) ) )
);
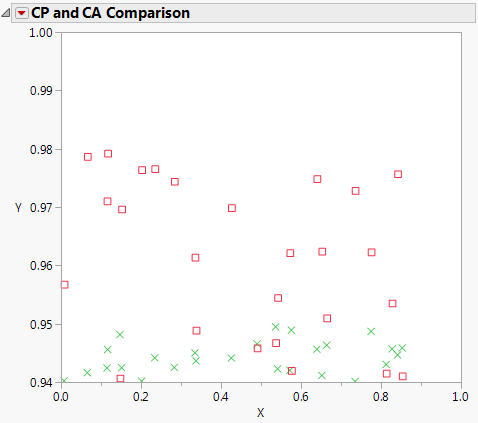
In the following example, row state values are prepared ahead and passed to the Marker routine, along with matrices of coordinates.
dt = New Table( "Artificial CP and CA data",
Add Rows( 26 ),
New Column( "cover_cp",
Numeric,
"Continuous",
Formula( Random Uniform() / 100 + 0.94 )
),
New Column( "cover_ca",
Numeric,
"Continuous",
Formula( Random Uniform() * 0.04 + 0.94 )
),
New Column( "p", Numeric, "Continuous", Formula( Random Uniform() ) )
);
dt << Run Formulas;
greenMark = Combine States( Marker State( 2 ), Color State( 4 ) );
redDiamond = Combine States( Marker State( 3 ), Color State( 3 ) );
New Window( "CP and CA Comparisons",
Graph Box(
Title( "CP and CA Comparison" ),
FrameSize( 400, 350 ),
X Scale( 0, 1 ),
Y Scale( 0.94, 1 ),
For Each Row(
Marker( greenMark, {p, cover_cp} );
Marker( redDiamond, {p, cover_ca} );
)
)
);
Figure 8.16 Example of Row States Values and Matrices