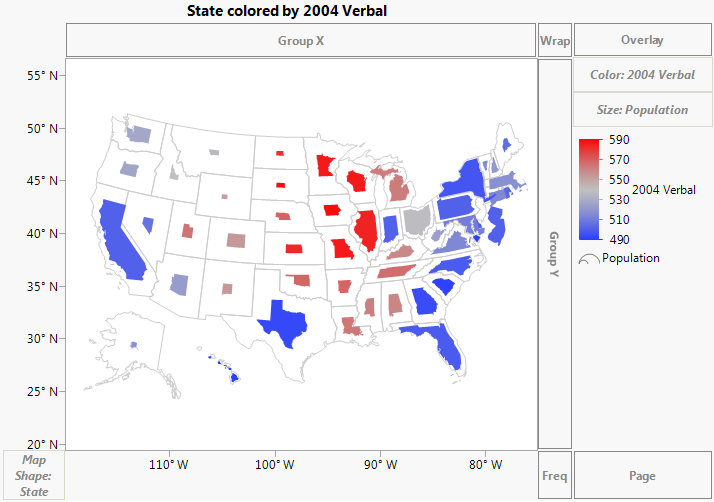
Use the Size element to scale map shapes according to the size variable, minimizing distortion.
|
1.
|
|
3.
|
Click OK.
|
You can also change the transparency of images (for example, Simple Earth and Detailed Earth). To set the transparency, right-click over the graph and select Customize.... This brings up the Customize Graph window, where you can select the Background Map and assign a value for transparency. A valid value for transparency goes from 0.0 (completely transparent) to 1.0 (completely opaque). Within Graph Builder, you can also right-click over the graph and select Graph > Transparency.
|
1.
|
Right-click on the color bar and select Gradient.
|
|
2.
|
In the Gradient Settings window, select a different Color Theme.
|
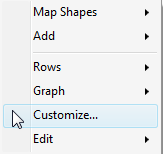
Graphs consist of markers, lines, text, and other graphical elements that you can customize. If you right-click an image, there are several options for working with the graph. The options differ based on what you clicked. For more information, see Gradient Settings in Graph Builder and Customize Graphical Elements in the Using JMP book. Below are a few options.
Figure 14.9 Right-click Menu for Graphics
|
•
|
Customize - You can change the properties of the graph such as contents, grid lines, or reference lines. The graphical elements that you can customize differ for each graph. Select Background Map to change the transparency of a background map or Map Shape to change the line color, line style and width, fill color, missing shape fill or missing value fill. Click Help in the Customize Graph window for a more detailed explanation of the customize options.
|