The Smoother element  shows a smooth curve through the data. The smoother is a cubic spline with a default lambda of 0.05 and standardized X values. You can adjust the degree of smoothness by changing the value of lambda using the slider.
Figure 2.26 Smoother Options
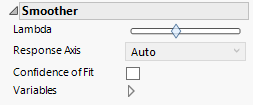
Change the default lambda of 0.05 using the slider. For more information about lambda, see Fit Spline in the Basic Analysis book.
Tip: If you have multiple graphs, you can color or size each graph by different variables. Drag a second variable to the Color or Size zone, and drop it in a corner. In the Variables option, select the specific color or size variable to apply to each graph.