There are two types of Statistical functions you can use in a formula:
|
•
|
The functions with names that have the prefix Col. These functions compute statistics for a column of numbers or expressions involving columns.
|
|
•
|
The Mean, Std Dev, Number, Sum, Quantile, Maximum, Minimum, and N Missing functions. These functions evaluate across columns or arguments. The statistic is computed for each row across the series of arguments. You can use the insert key (
 ) on the on-screen keypad, or type a comma to add arguments to the functions that accept multiple arguments. When there are multiple contiguous arguments, select the function and the first argument, and then Shift-click the last argument in the group. These functions then automatically show with the complete list. ) on the on-screen keypad, or type a comma to add arguments to the functions that accept multiple arguments. When there are multiple contiguous arguments, select the function and the first argument, and then Shift-click the last argument in the group. These functions then automatically show with the complete list. |
Calculates the mean (or arithmetic average) of the numeric values identified by its argument. The formula Col Mean(age) calculates the average of all nonmissing values in the age column.
Takes the minimum of its numeric arguments. Col Minimum ignores missing values. Col Maximum takes the maximum of a numeric column argument and ignores missing values.
The Col Quantile function’s quantile argument represents the quantile percentage divided by 100. The 25% quantile, also called the lower quartile, corresponds to p = 0.25, and the 75% quantile, called the upper quartile, corresponds to p = 0.75.
The Formula Editor computes a quantile for a column of n nonmissing values by arranging the values in ascending order. The subscripts of the sorted column values, y1, y2,...,yn, represent the ranks in ascending order.
The pth quantile value is calculated using the formula p(n + 1), where p is the percent value and n is the total number of nonmissing values. If p(n+1) is an integer, then the quantile value is yp(n+1). If p(n + 1) is not an integer, then the value is interpolated by assigning the integer part of the result to i, assigning the fractional part to f, and applying the formula (1 – f)yi + (f)yi+1.
For example, suppose a column has values 2, 4, 6, 8, 10, 12, 14, 16, 18, and 20. The 50% quantile is calculated as 0.5(10 + 1) = 5.5.
The following are example ColQuantile formulas:
|
•
|
ColQuantile(age, 1) Calculates the maximum age.
|
|
•
|
ColQuantile(age, 0.75) Calculates the upper quartile age.
|
|
•
|
ColQuantile(age, 0.5) Calculates the median age.
|
|
•
|
ColQuantile(age, 0.25) Calculates the lower quartile age.
|
|
•
|
ColQuantile(age, 0) Calculates the minimum age.
|
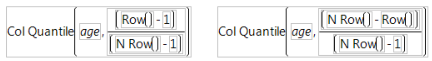
The ColQuantile argument can be any expression that evaluates to a value between (and including) 0 and 1. For example, the first formula in Figure A.13 calculates quantile values of age in ascending order for each row. The column then contains the interpolated values of age in ascending order in the calculated column. The second formula lists the interpolated values of age in descending order.
Figure A.13 Examples of the Quantile Function
Performs the usual standardization on its numeric expression. For each row i, Col Standardize(height) is (HeightRow()–Col Mean(Height))/Col Std Dev(Height).
Calculates the arithmetic average of the nonmissing values in the list of arguments that you specify. The arguments can be constants, numbers, or expressions. The Mean function initially shows with a single argument. You add arguments with the insert button () on the Formula Editor keypad or by typing a comma.
) on the Formula Editor keypad or by typing a comma.Computes standard deviation of the nonmissing values in the list of arguments that you specify. The arguments can be constants, numbers, or expressions. The Std Dev function initially shows with a single argument. You add arguments by clicking the insert button () on the Formula Editor keypad or by typing a comma.
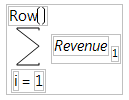
) on the Formula Editor keypad or by typing a comma.Evaluates for an explicit range of values in a column, as given by the summation indices. This behavior is different from all other statistical functions (except Product), which always evaluate on every row. The Summation function uses the summation notation shown in Figure A.14. To calculate a sum, replace the missing body term with an expression containing the index variable i, or an index variable that you assign. Summation repeatedly evaluates the expression for i = 1, i = 2, through i = NRow() and then adds the nonmissing results together to determine the final result.
You can replace NRow(), the number of rows in the active spreadsheet, and the index constant, i, with any expression appropriate for your formula. For example, the summation formula in Figure A.14 computes the total for each row of all revenue values for rows 1 through the current row number, filling the calculated column with the cumulative totals of the revenue column.
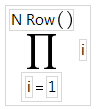
Evaluates for an explicit range of values in a column, as given by the summation indices, as opposed to all other statistical functions (except Summation), which always evaluate on every row. Product uses the notation shown in the formula in Figure A.15. To calculate a product, replace the missing body term with an expression containing the index variable j. Product repeatedly evaluates the expression for i = 1, i = 2, through i = n and multiplies the nonmissing results together to determine the final result.
You can replace NRow(), the number of rows in the active spreadsheet and the index constant, i, with any expression appropriate for your formula.