Figure 4.4 The Initial Categorical Report
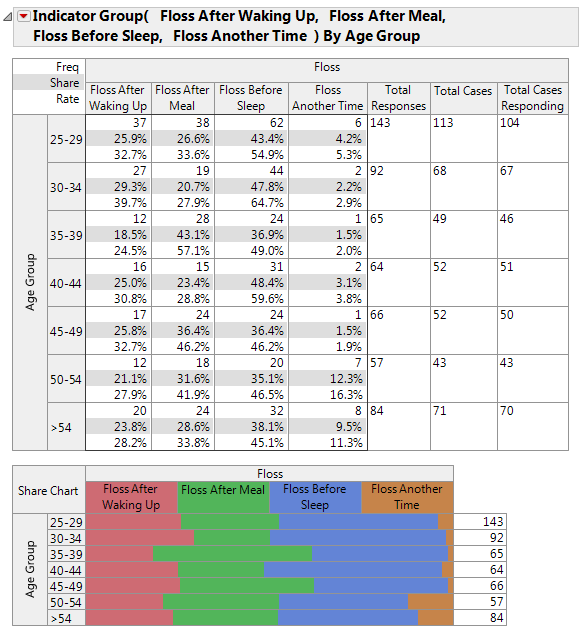
In Figure 4.4, the number of responses and cases for each age group are displayed. Consider the first row of the table with the results for those in the 25 through 29 age group.
JMP Support 800.450.0135 (US)
Documentation Feedback
Your feedback is important to us.
us any comments about
our documentation.