|
•
|
By default, a summary of the model for the specified number of clusters appears at the top of each Latent Class Model report. The model summary contains the -LogLikelihood, Number of Parameters, BIC, and AIC. These summary values can be used to determine how well the model fits the data. Lower values of -LogLikelihood, BIC, and AIC indicate better fits. For more information, see Likelihood, AICc, and BIC in the Fitting Linear Models book. The Number of Parameters value gives the number of unique parameters in the latent class model. For more information, see Statistical Details for the Latent Class Analysis Platform.
The Overall column shows the probability of an observation belonging to each cluster. (These are the γ parameters. See Statistical Details for the Latent Class Analysis Platform.)
The graphical display shows the conditional probability values as share charts. For each cluster and each Y, the conditional probabilities given cluster membership are plotted as a horizontal stacked bar chart. For a binary or nominal response column, the percentages in these charts sum to one for each response. For a multiple response column, the percentages are of the lower level of each of the categories and do not sum to one. The stacking of bars follows the order of appearance of the variables in the table of values. You can also place your cursor over the bars to view the levels or categories of the variable.
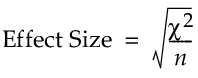
For each response, the Pearson chi-square statistic, χ 2, is calculated for the contingency table of expected counts for levels by clusters. Let n represent the number of observations. The value in the Effect Size column is defined as follows:
Each value in the LR Logworth column shows -log10(pLR) where pLR is the likelihood ratio test p-value for the contingency table of expected counts. A Logworth value above 2 corresponds to significance at the 0.01 significance level.
The MDS Plot contains one point for each cluster and is displayed by default. It is a two-dimensional representation of cluster proximity. Clusters that are closer together are more similar. The plot is created from a dissimilarity matrix of the ρ parameters. For more information about MDS plots, see the Multidimensional Scaling topic.