Note: The axes of prediction profiler traces range from the defined upper and lower bounds of the factors, p1, p2, and p3. When you explore the effect of a component and the limit of a second component is reached, it cannot move further and only the third variable changes to maintain the mixture constraint.
|
2.
|
To the visible profile curves to bounds that take into account the levels of all three components, click the Prediction Profiler red triangle and select Profile at Boundary > Stop at Boundaries.
|
|
3.
|
To optimize the mixture components click the Prediction Profiler red triangle and select Optimization and Desirability > Desirability Functions.
|
|
4.
|
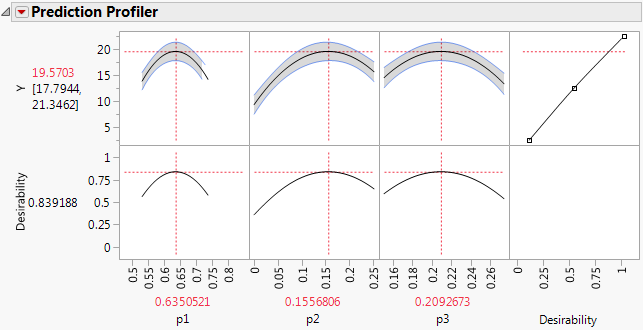
Click the Prediction Profiler red triangle and select Optimization and Desirability > Maximize Desirability to obtain the optimal factor settings for maximum Y.
|
The profiler in Figure 12.25, displays optimal settings (rounded) of 0.6350 for p1, 0.1557 for p2, and 0.2093 for p3, which give an estimated response of 19.5703.